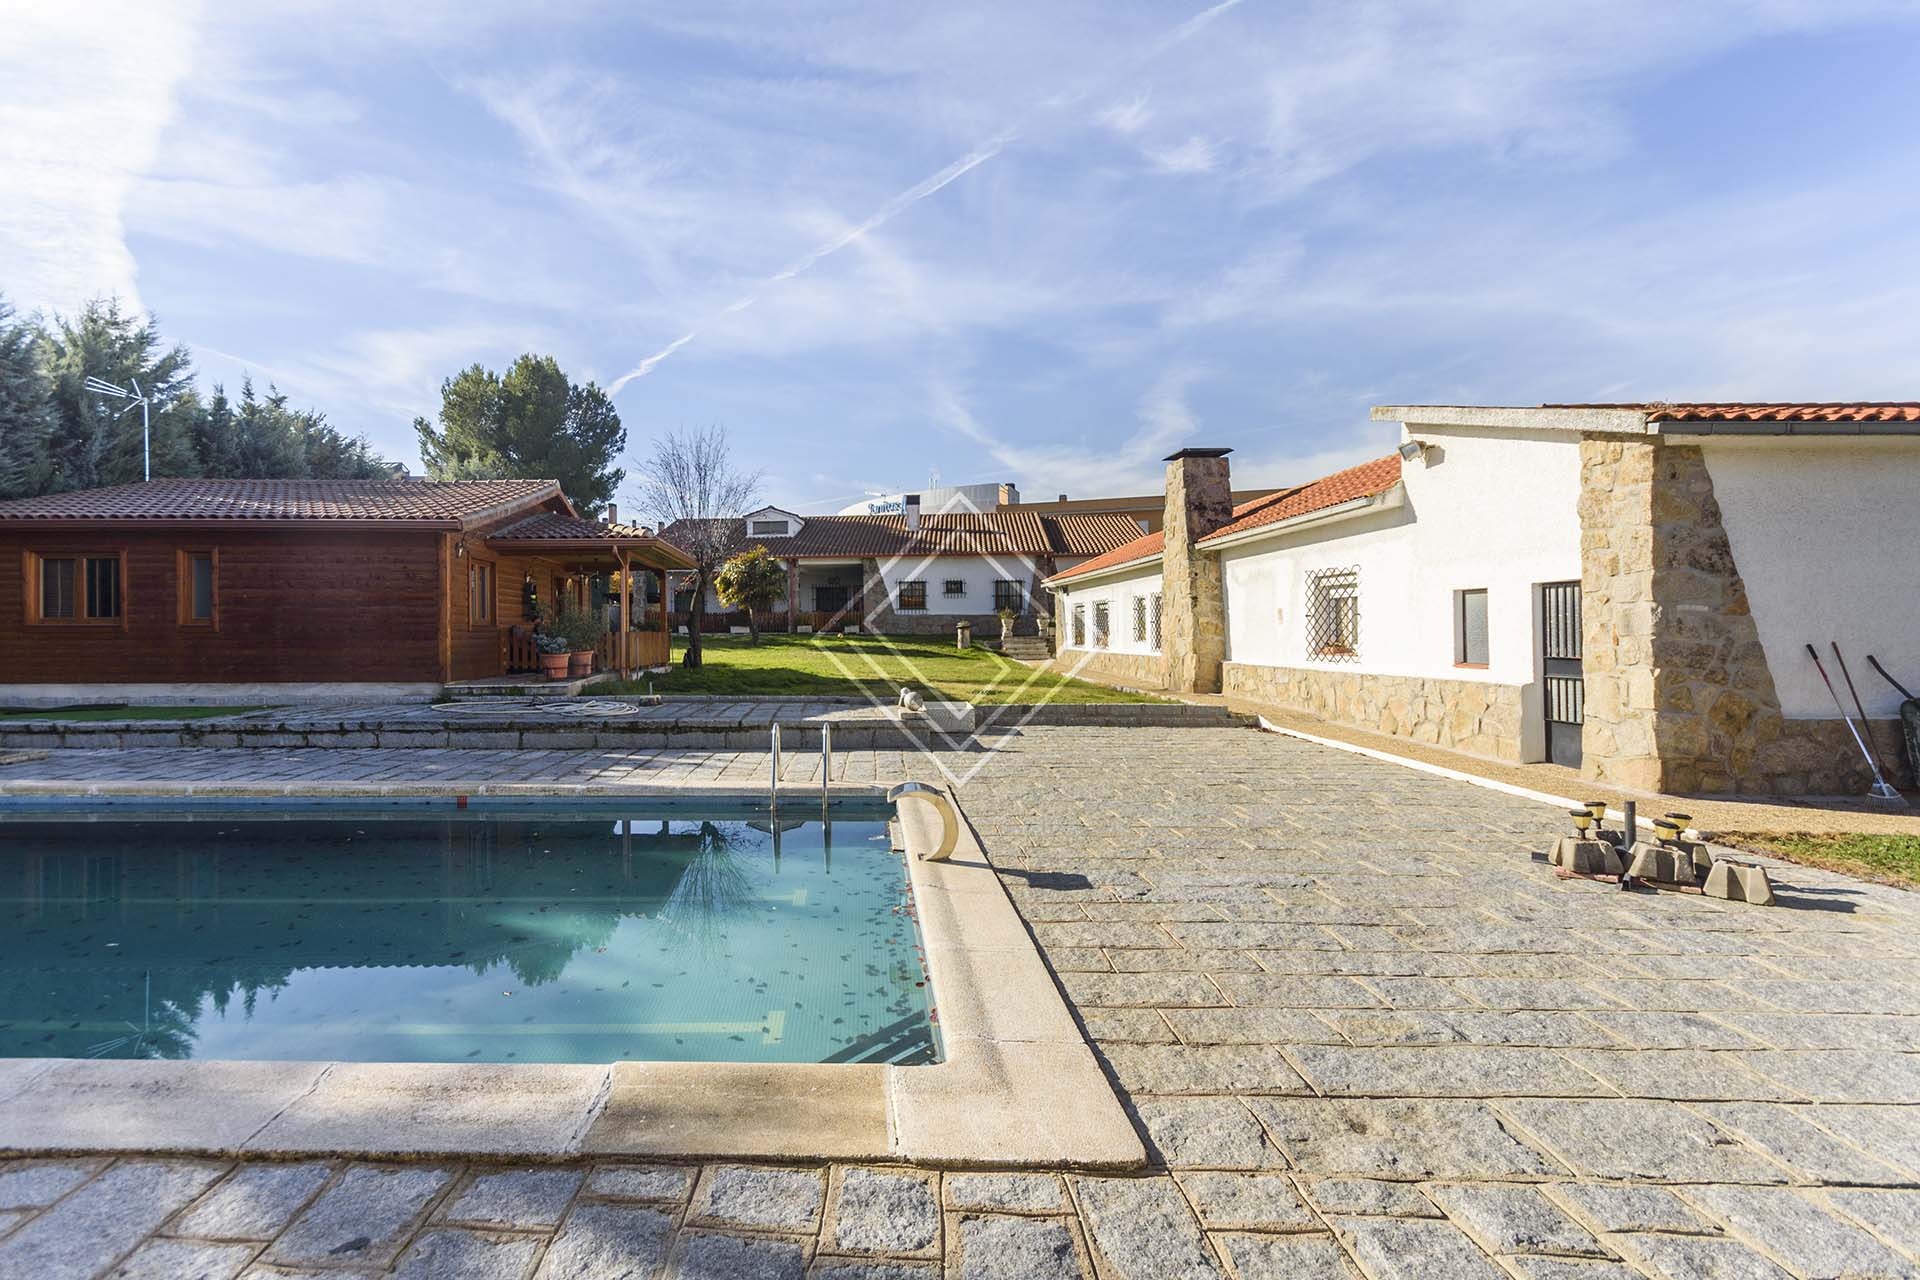
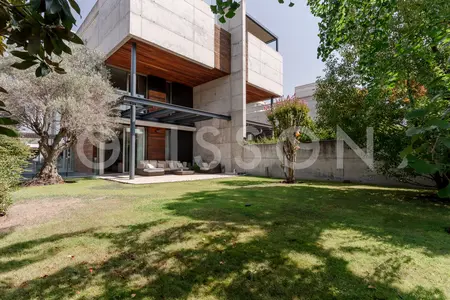
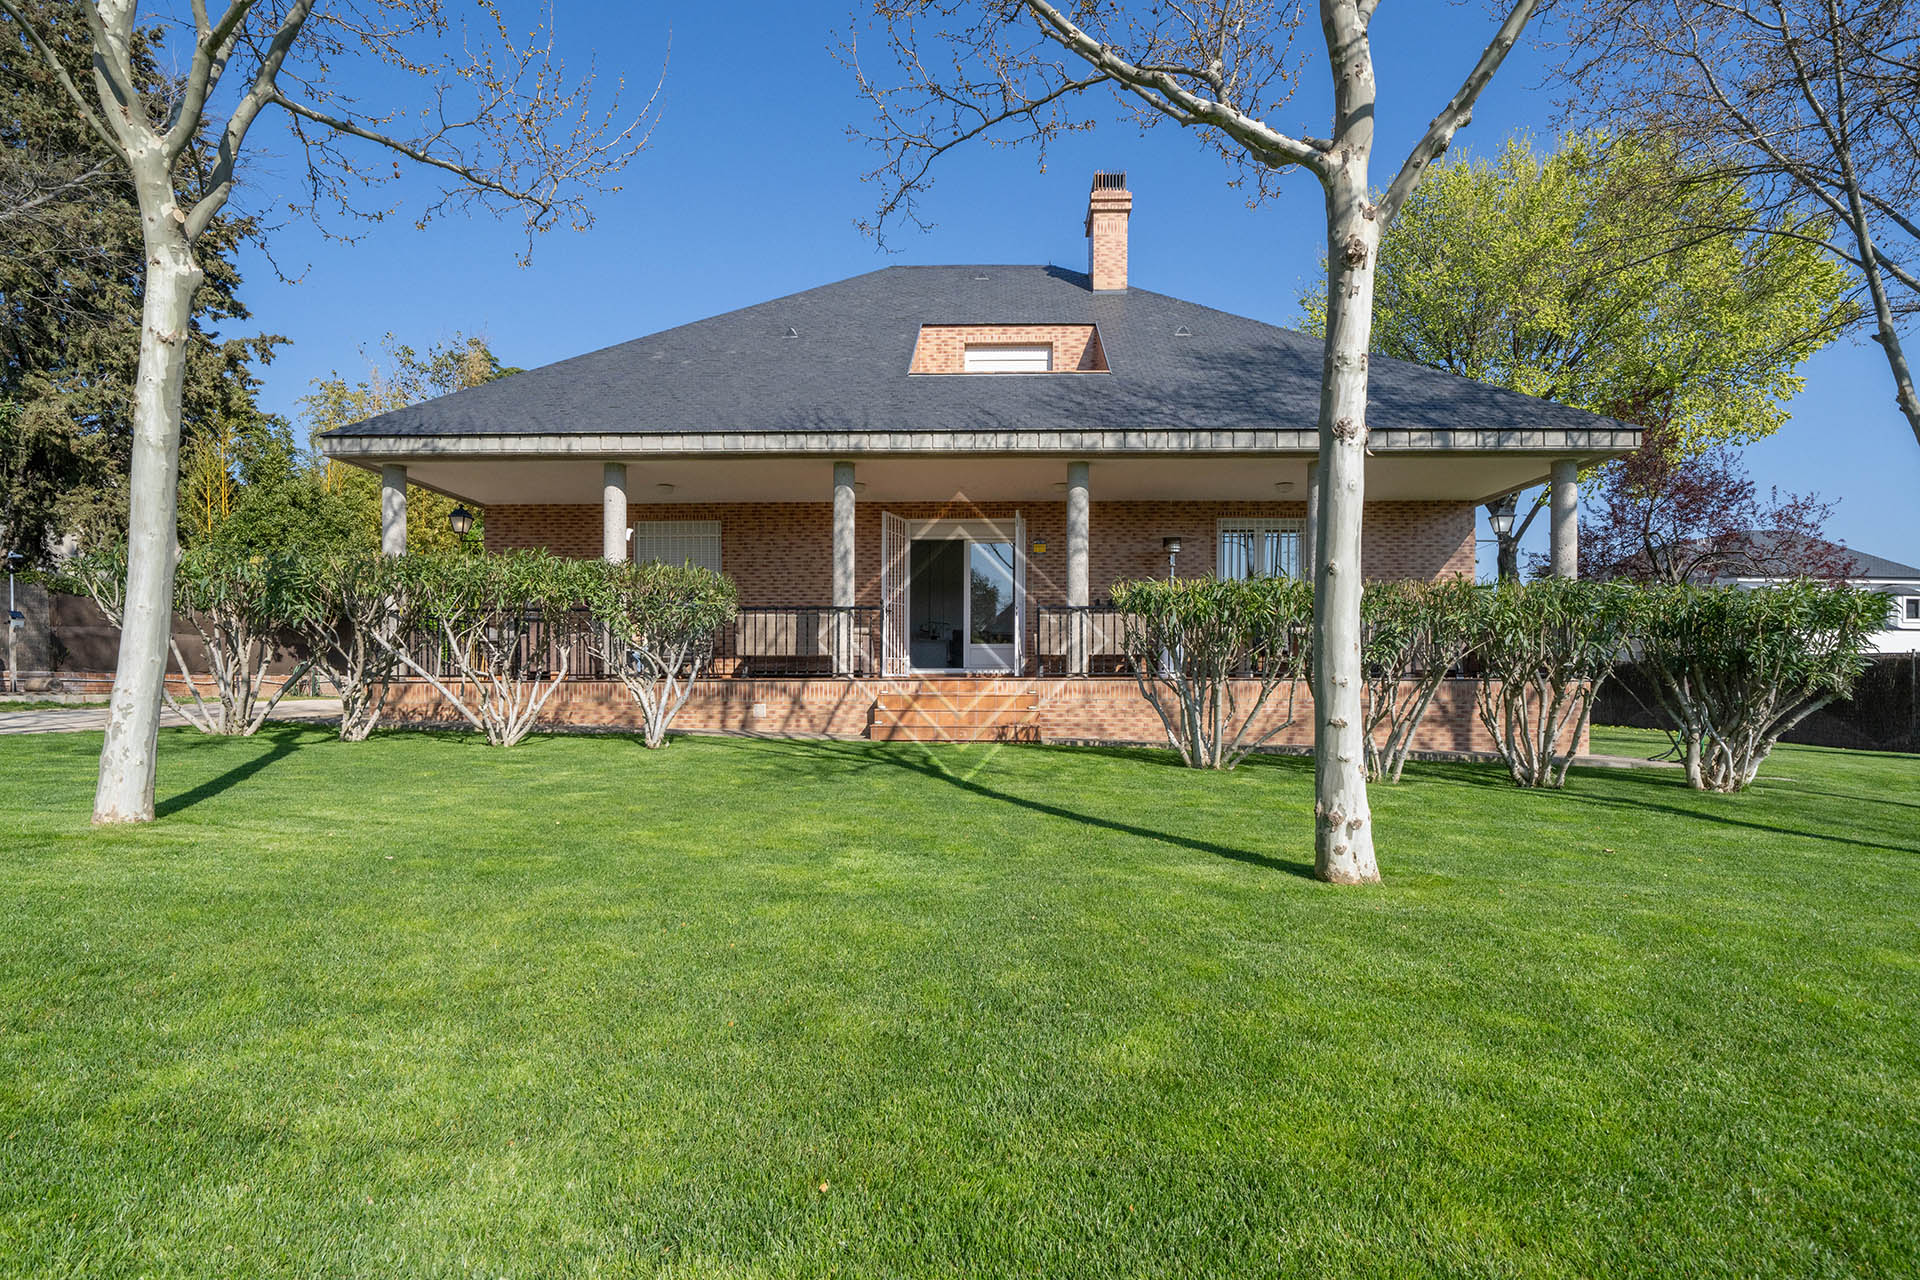
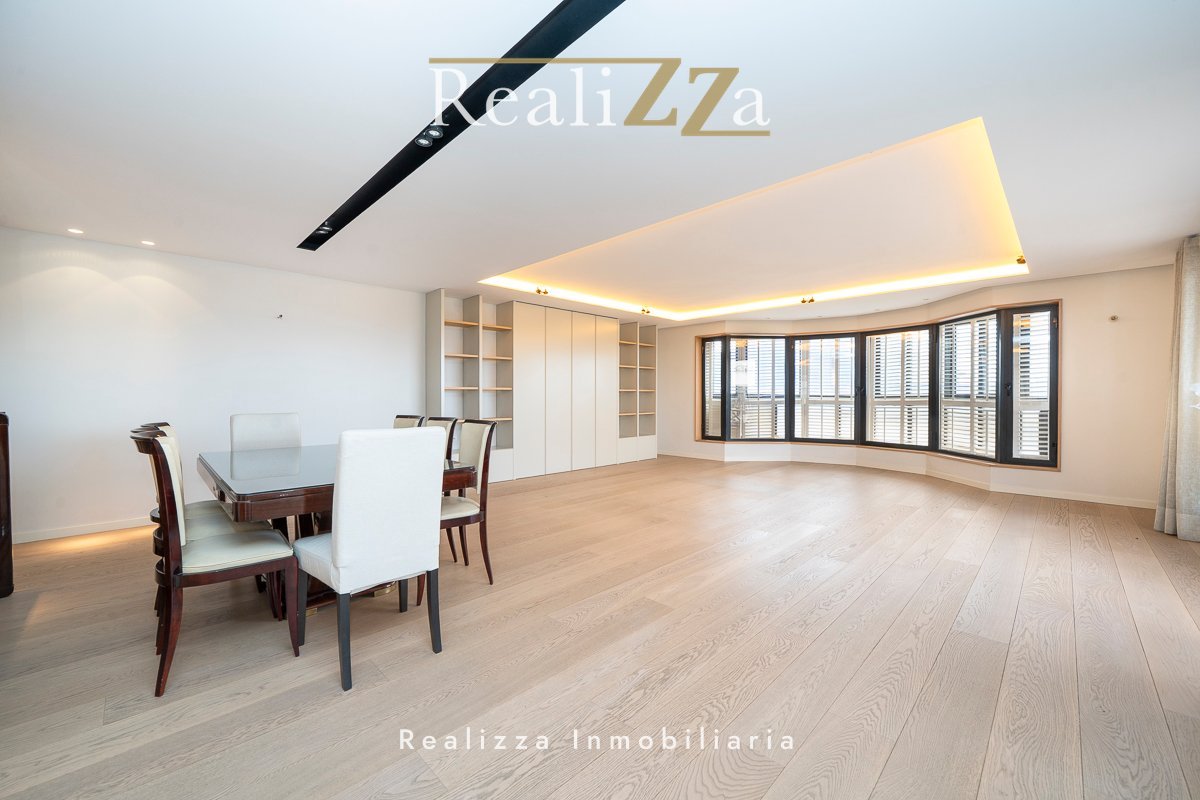
In November 2026, homes for sale in Aravaca asked a typical €6,334 per m², across the 199 listings Frankly tracks. Registered sales in the same barrios were about €6,300 per m², so asking prices run about 1% higher. How we got this
Village feel inside the city limits. The international-school corridor, family-scale houses, and green space between them.
199
homes for sale we track right now · from 16 agencies, checked this morning
What living here is like, who it suits and what you give up. Written by Frankly and checked against official sources on 28 September 2026.
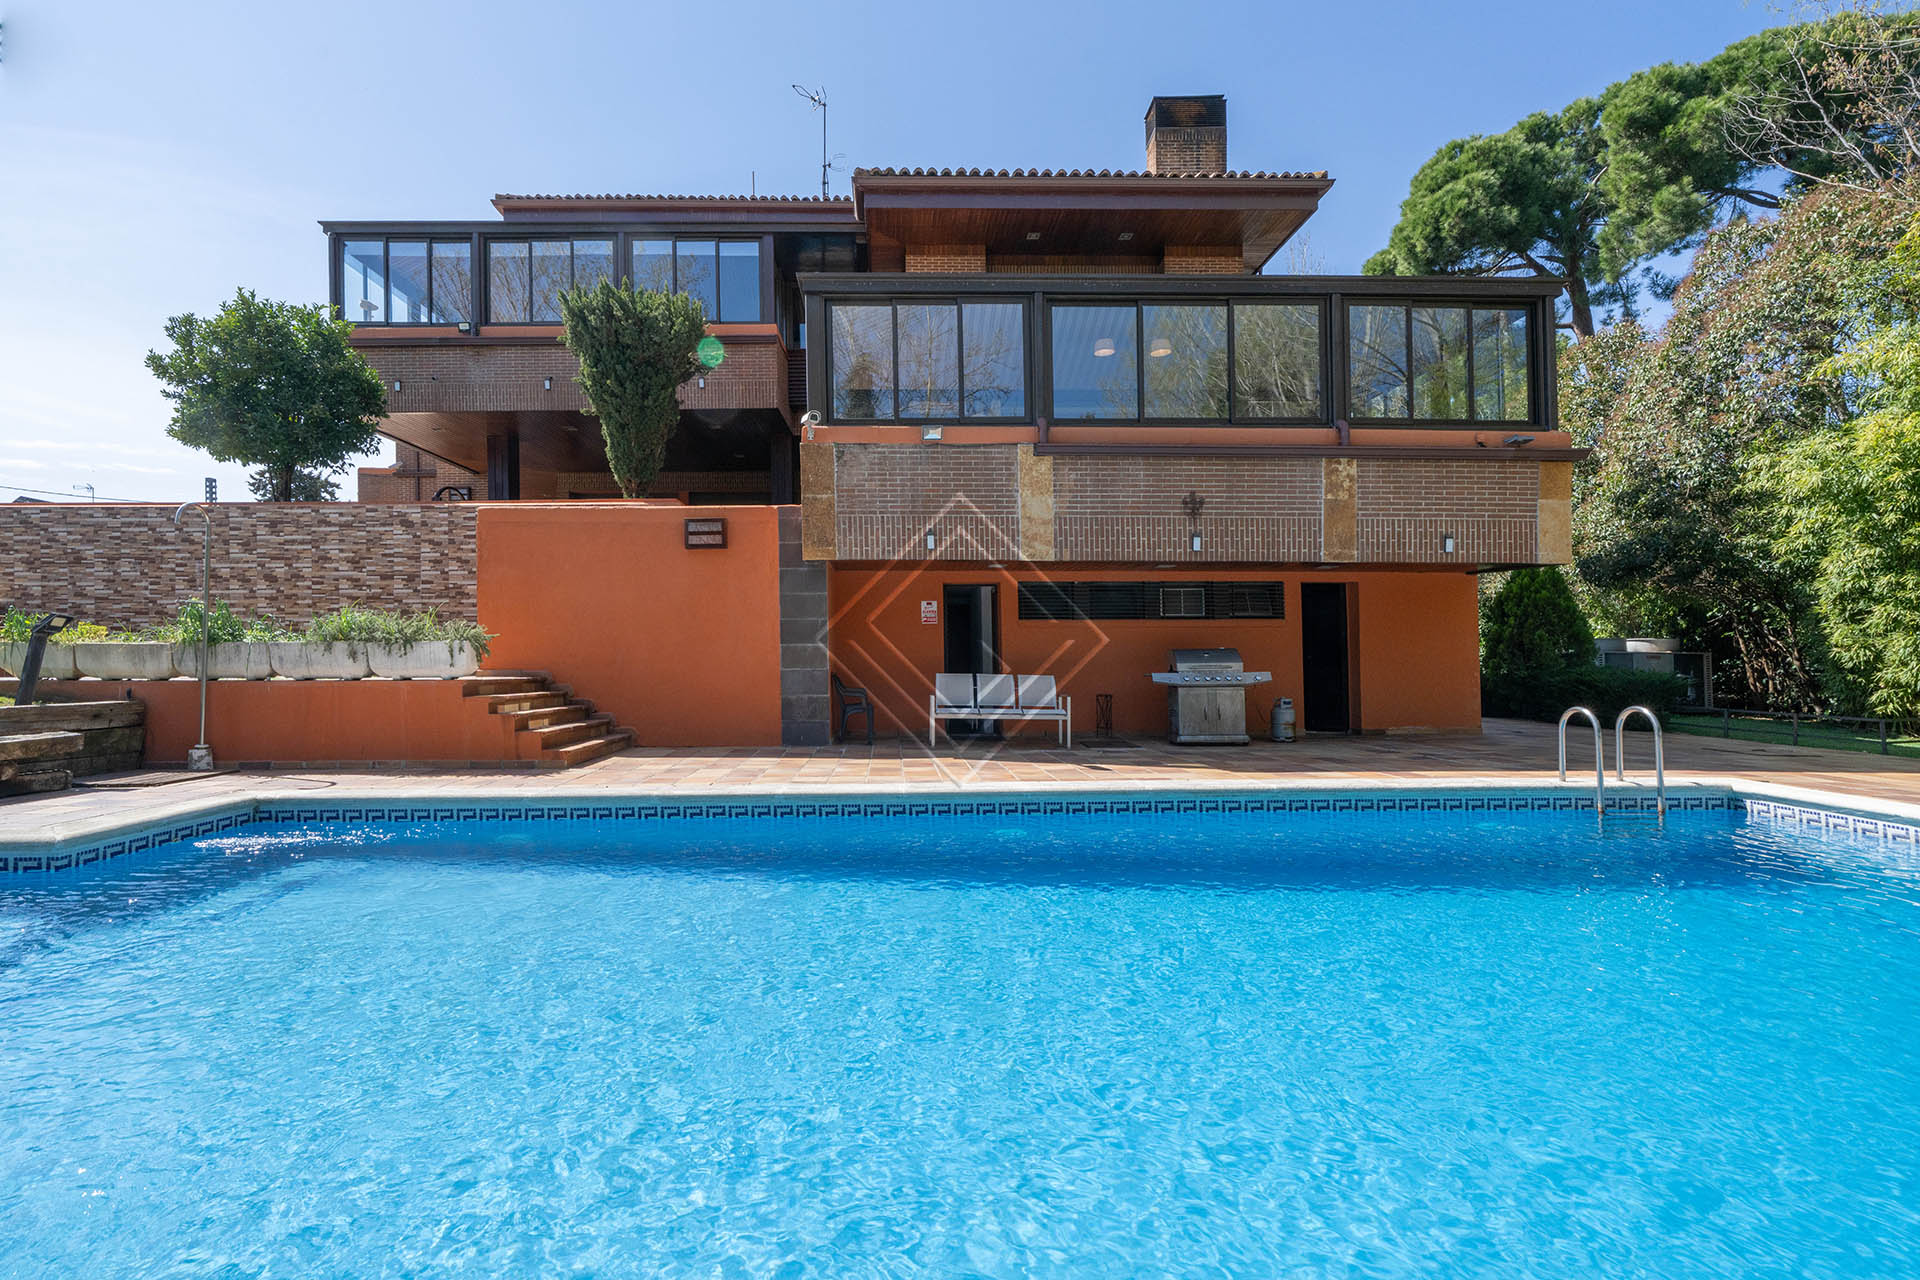
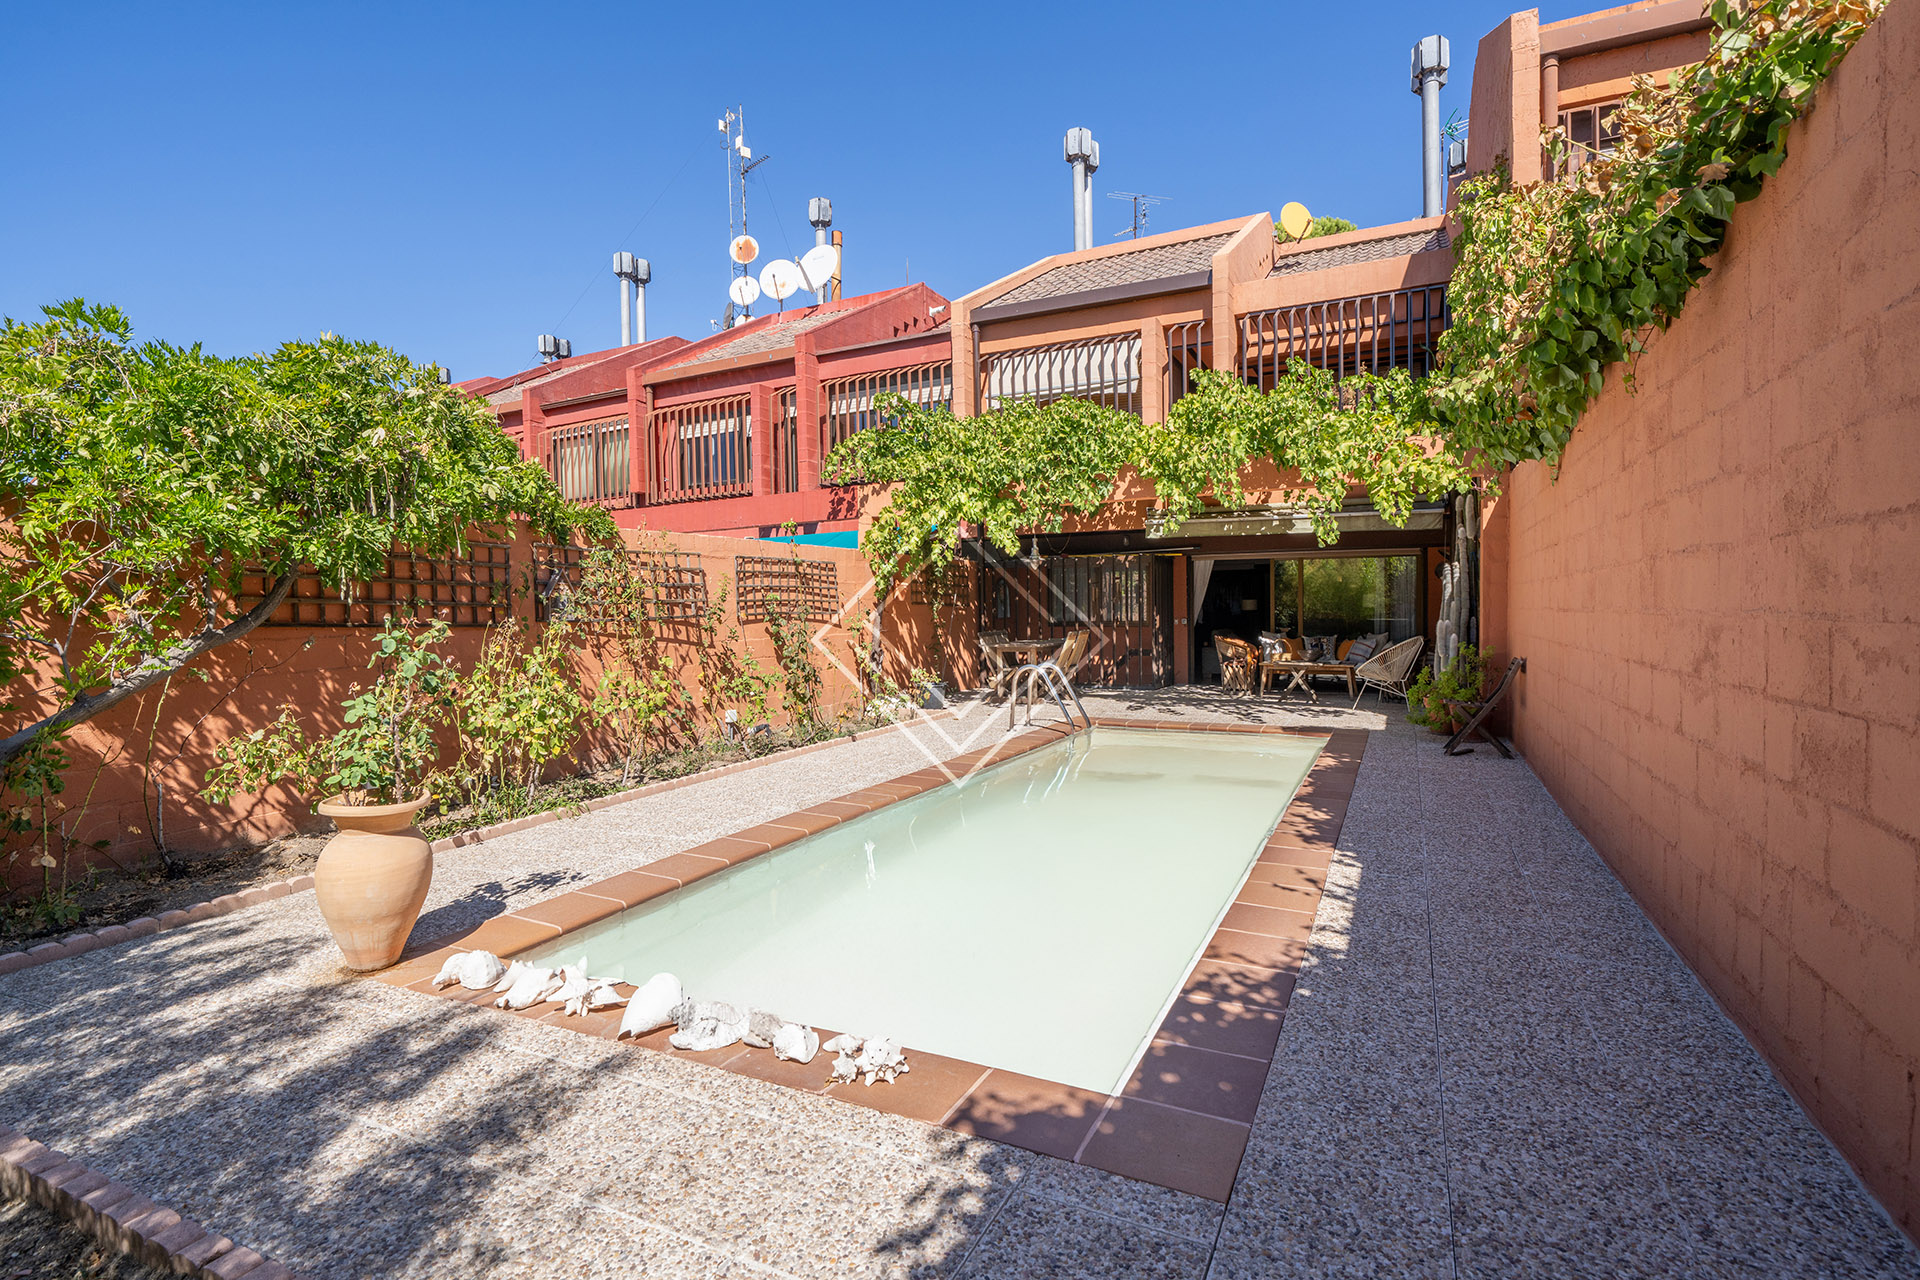
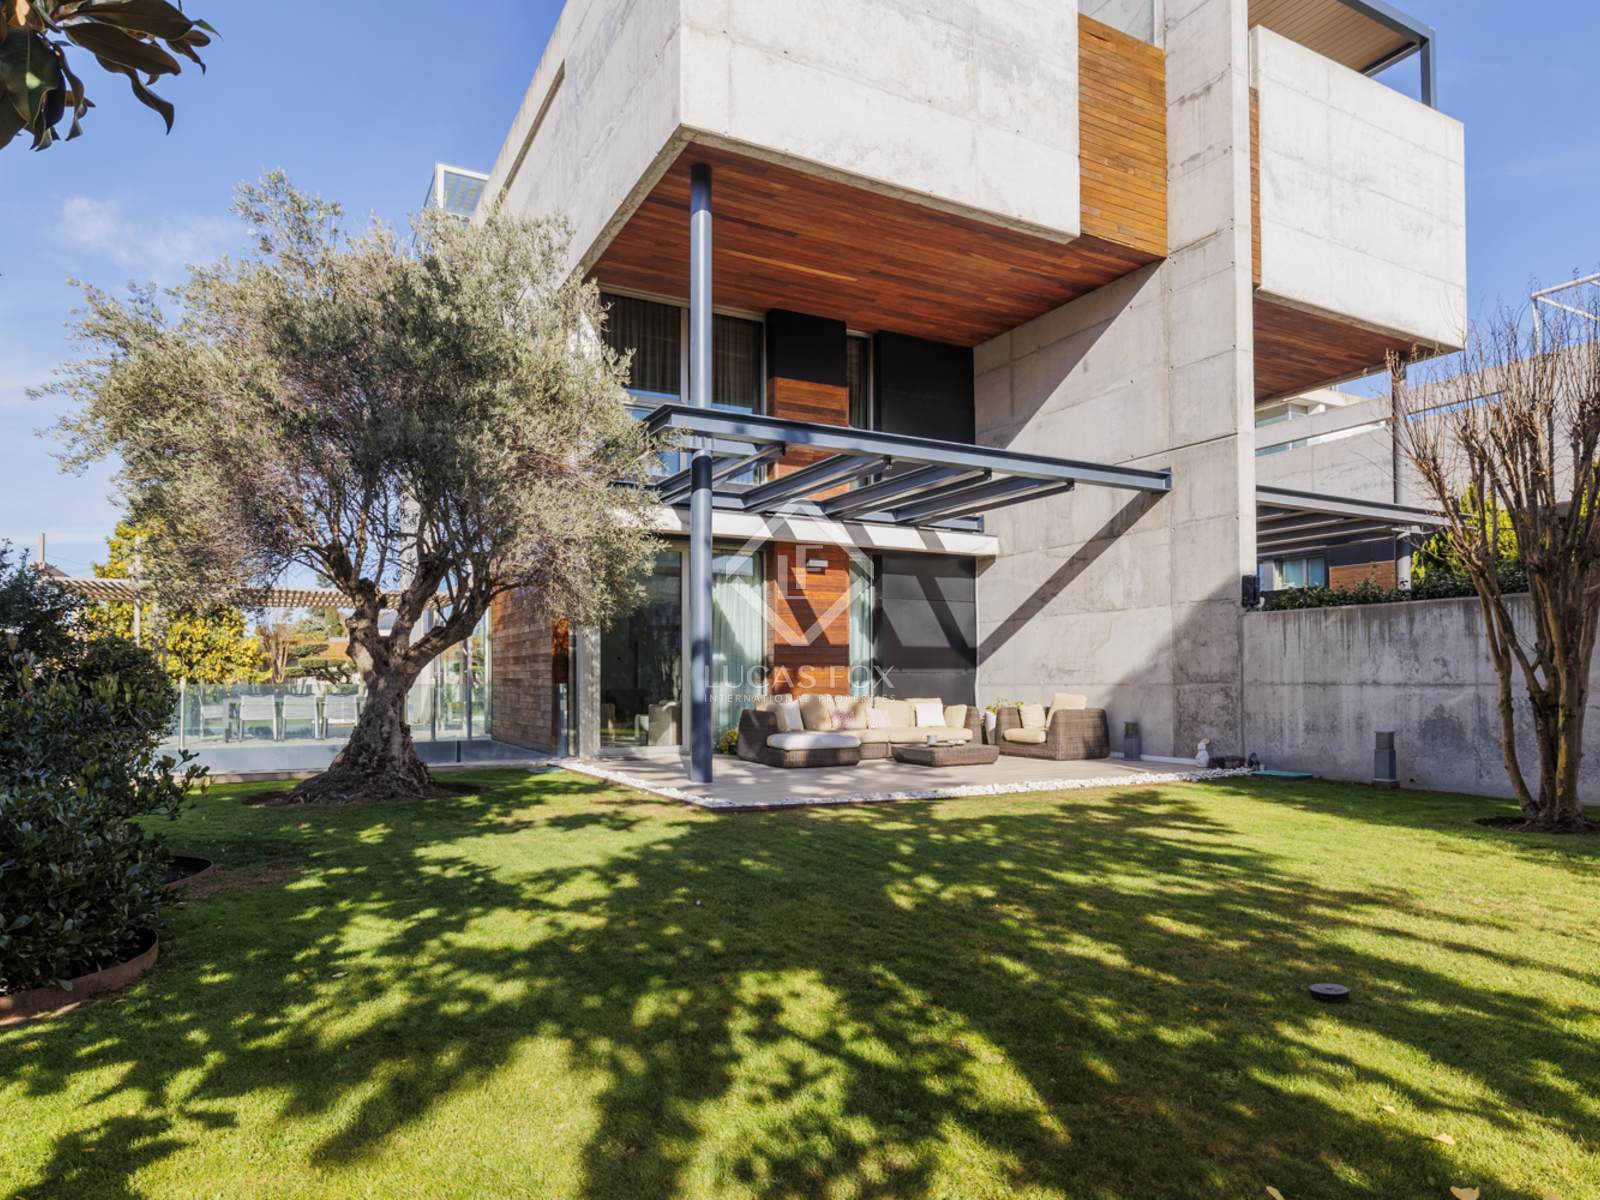
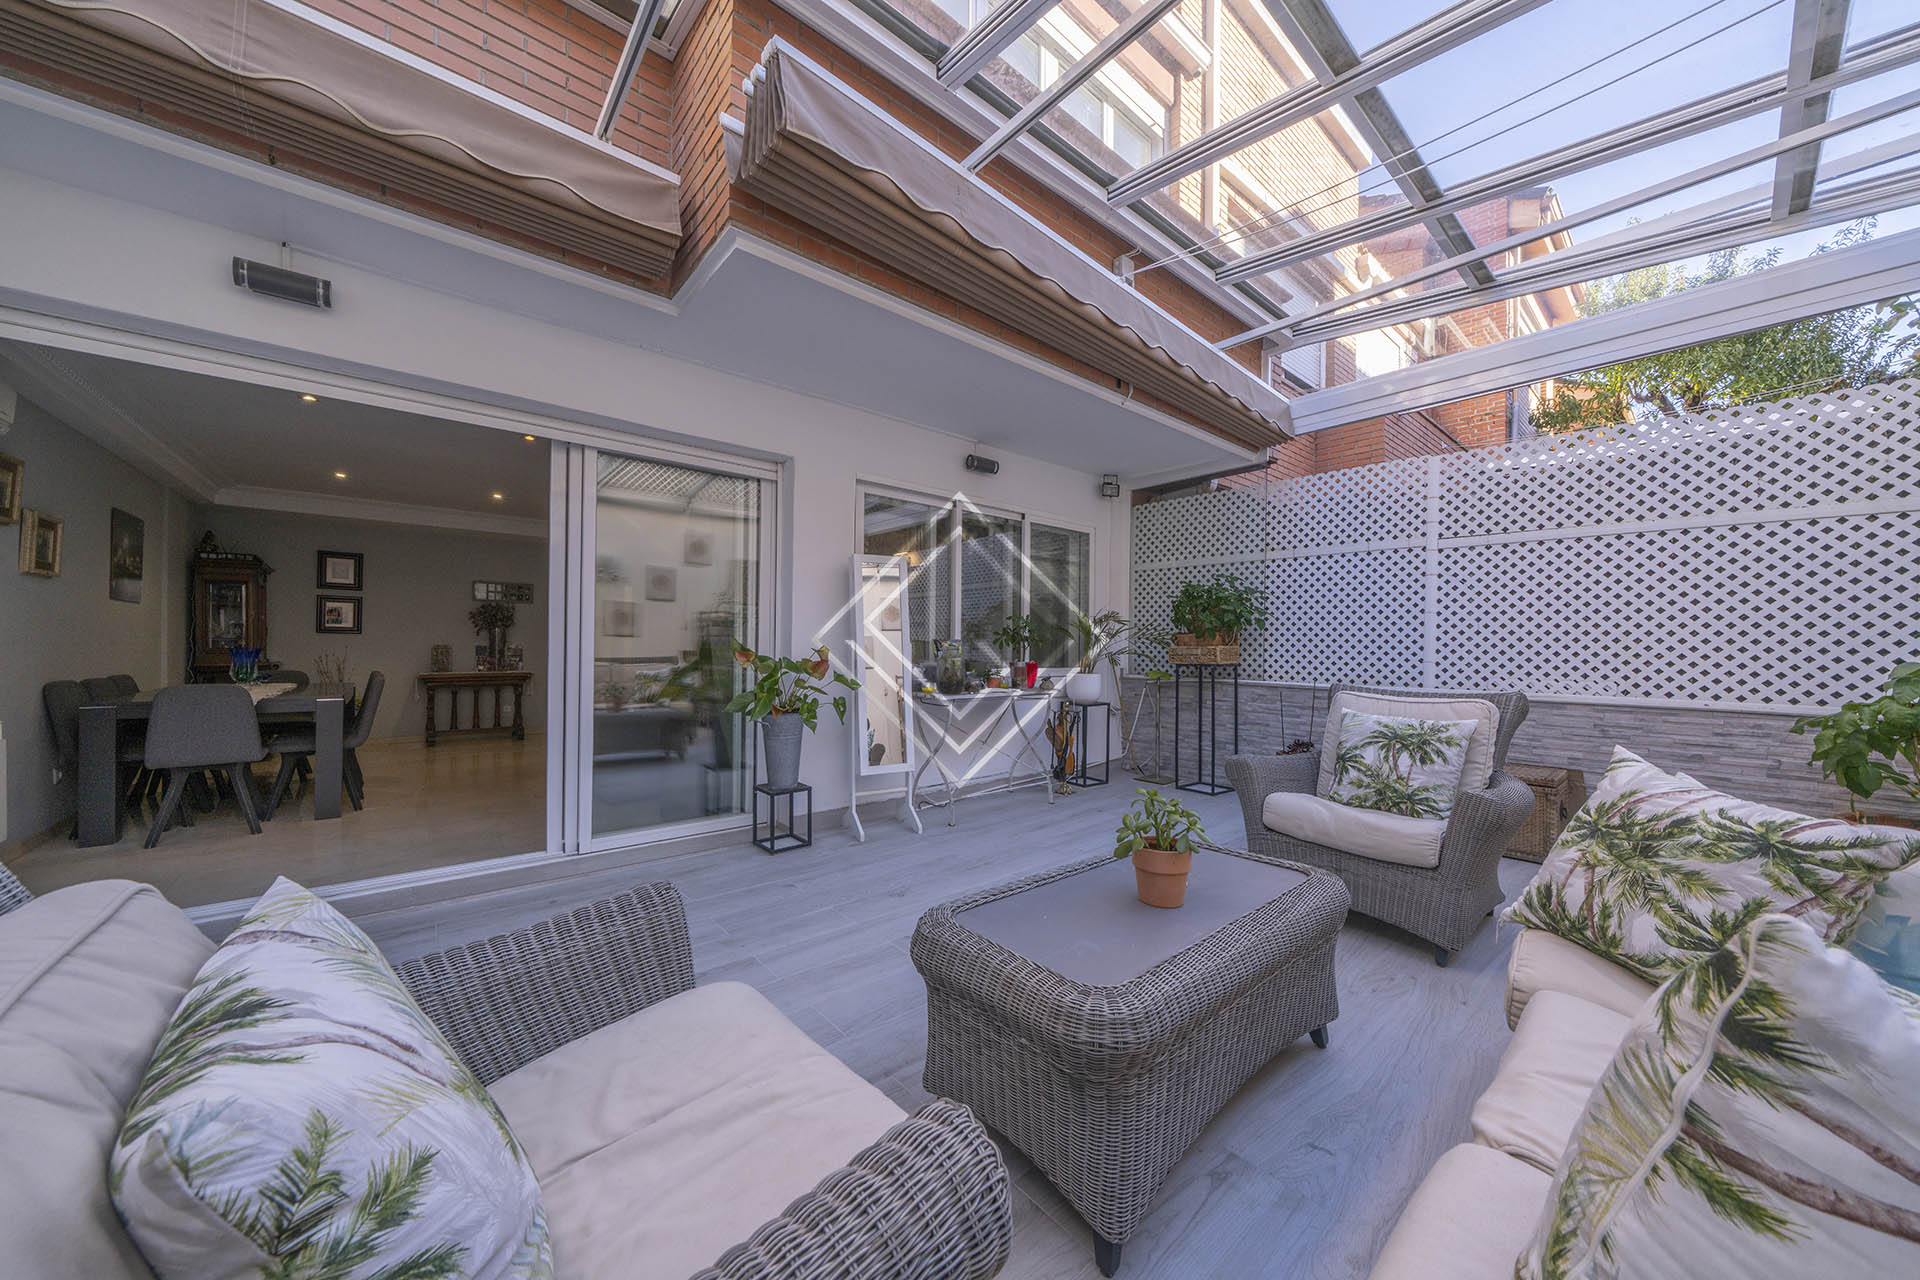
Aravaca sits in Madrid's north-west — inside the city limits (it is a barrio of the Moncloa-Aravaca district) but functionally a suburb, with the character of an upscale village that happens to be administratively inside the capital. The old village core keeps a small-town feel around its parish church, Nuestra Señora de la Asunción, rebuilt after the Civil War, while the residential belts around it are part of Madrid's western international-school corridor: The English Montessori School (in neighbouring El Plantío), Internacional Aravaca and, just across the municipal line in Pozuelo, the American School of Madrid.
It suits
International families with kids at TEMS, Internacional Aravaca, or the American School who want school proximity without La Moraleja's distance from the city
Buyers who want a "village within the city" feel with detached or semi-detached living
Families who prefer Madrid-municipal services over Alcobendas
Professionals who commute into Madrid by Cercanías rather than only by car
Think twice if
Anyone wanting urban walkability beyond the village core (the surrounding belts are car-first)
Buyers chasing the very top address prestige (La Moraleja and Puerta de Hierro dominate the ultra-prime suburban bracket)
Young singles or couples (this is firmly a family neighborhood)
Those needing regular proximity to central Madrid's cultural spine (the commute to the centre takes around half an hour by Cercanías)
Schools and metro, barrio by barrio
Every school and Metro station inside the official boundary of Aravaca. No distances: we know which barrio a home is in, not its exact door.
Schools in Aravaca primary and secondary, plus international early years
School
Type
Stages
CEIP AravacaPúblicoPrimary · Calle del Estudio 6Calle del Estudio 6
Público
Primary
CEIP Rosa LuxemburgoPúblicoPrimary · Calle del Bardegueral 16Calle del Bardegueral 16
Público
Primary
IES Ana FrankPúblicoSecondary · Calle del Arroyo de PozueloCalle del Arroyo de Pozuelo
Público
Secondary
BernadetteConcertadoPrimary · Secondary · Calle de Santa Bernardita 1Calle de Santa Bernardita 1
Concertado
Primary · Secondary
Los RoblesConcertadoPrimary · Secondary · Avenida de la Osa Mayor 239Avenida de la Osa Mayor 239
Concertado
Primary · Secondary
María ReinaConcertadoPrimary · Secondary · Calle de Aranzueque 4Calle de Aranzueque 4
Concertado
Primary · Secondary
Colegio IngenioPrivadoPrimary · Secondary · Calle de Zenit 15Calle de Zenit 15
Privado
Primary · Secondary
Dionisia PlazaPrivadoPrimary · Calle de los Espinos 10Calle de los Espinos 10
Privado
Primary
Internacional AravacaPrivadoPrimary · Secondary · Calle de Santa Bernardita 3Calle de Santa Bernardita 3
Privado
Primary · Secondary
Pedagogía Waldorf de AravacaPrivadoPrimary · Calle de Zenit 10Calle de Zenit 10
Privado
Primary
Santa María de los RosalesPrivadoPrimary · Secondary · Calle de la Virgen de los Rosales 1Calle de la Virgen de los Rosales 1
Privado
Primary · Secondary
Público: a state school, free. IES is a state secondary school; CEIP a state infant and primary school.
Concertado: privately run, state-funded, mostly free; many are religious.
Privado: private and fee-paying. None of Aravaca’s schools teaches a foreign curriculum.
Metro stations
ML2Estación de AravacaLine ML2
Stations with a street entrance inside Aravaca.
Parks and gardens
Parque Cerro Águila21.2 ha
Parque Cuesta del Galbán7.1 ha
Parque de La Rinconada4.3 ha
Parque Arroyo Pozuelo
Prices, rents and who lives here
Aravaca as a whole, compared with Madrid.
Neighbourhood
€83,039household income a yeara year
Madrid €49,916Household income · Madrid €49,916
Official barrio
People
Population
down 1.0% in a year
28,183
Average age
Madrid 44.1
41.9
Aged 65 or over
Madrid 20.6%
19.1%
Registered unemployment
Madrid 5.8%
3.2%
Years of income to buy
average-size home (161 m²) ÷ household income · Madrid 9.7
12.2 years
SaleAravaca · askingasking
€6,469per m²
Madrid, homes we track: €11,329
Price trend
up 14.3%in a year·up 3.3%on the quarter
Official price index · all second-hand sales in the district · Moncloa-Aravaca figure
What homes here sold for
Homes here sold for about
registered sales in the barrios where the homes we track are, brought up to this quartersame barrios as the homes we track
€6,300/m²
Asking vs sold
Homes we track ask about 3% more than recorded sales in the same barrios.about 3% more, same barrios
+3%
Homes for sale now
Priced below our fair value
of 116 homes we can read
22%
Typical time advertised
since we first saw each one
62 days
Have cut their price
29 of 199
15%
RentAravaca · askingasking
€20.5per m² a month
Madrid, homes we track: €31.3
Rent trend
little change −0.5%on the month
Asking rents we track, not the market
What tenants pay on existing leases
In 2024 · Moncloa-Aravaca figure
up 3.5% that year
€15.5 per m²
Homes to rent now
Typical asking rent
half ask less, half more
€4,850 a month
Typical time listed
since we first saw each one
48 days
No grade for mortgage defaults or homes occupied without a lease (ocupación), on purpose. Spain publishes both only for the whole province, so an Aravaca grade would be invented precision.
The market over time
How Aravaca’s market has moved
Aravaca is a barrio (one of the city’s official neighbourhoods) in Moncloa-Aravaca. Sale prices and sales are Aravaca’s own, published from 2016; rent is our estimate for Aravaca. Each is compared with Moncloa-Aravaca. The official price index exists only for the whole district.
What homes sold for in Aravaca, since 2016
€5,603per m²
up 12.2%in a year
Average price per m² in registered sales of second-hand homes in Aravaca, 2025. Published from 2016. With about 90–290 sales a year, single years move more than Moncloa-Aravaca’s.
2025Aravaca€5,603Moncloa-Aravaca€5,694
€3,000
€4,000
€5,000
€6,000 per m²
2016201920222025
201620202025
201620202025
What homes sold for in Aravaca, since 2016
Year
Aravaca
Moncloa-Aravaca
2025
€5,603
€5,694
2024
€4,995
€4,938
2023
€4,542
€4,541
2022
€4,389
€4,327
2021
€3,959
€3,910
2020
€3,746
€3,757
2019
€3,896
€3,874
2018
€3,634
€3,687
2017
€3,562
€3,358
2016
€3,057
€2,916
Moncloa-Aravaca’s official price index, since 2022
+50.3%since early 2022
Published only for the whole district: there is no barrio index. 2022 = 100. Madrid rose 53.8% over the same quarters.
Q2 2026Moncloa-Aravaca147.4Madrid149.6
100
120
140
160 · index, 2022 = 100
Q1 2022202320242025Q2 2026
Q1 20222024Q2 2026
Q1 2022Q2 2026
Moncloa-Aravaca’s official price index, since 2022
Quarter
Moncloa-Aravaca
Madrid
Q2 2026
147.4
149.6
Q1 2026
142.7
145.9
Q4 2025
137.6
140.5
Q3 2025
133.9
138.5
Q2 2025
129.0
133.2
Q1 2025
122.8
126.9
Q4 2024
117.9
120.4
Q3 2024
113.1
116.8
Q2 2024
112.9
113.0
Q1 2024
107.0
108.5
Q4 2023
108.2
107.0
Q3 2023
108.7
105.8
Q2 2023
104.1
104.3
Q1 2023
103.5
102.6
Q4 2022
100.9
101.9
Q3 2022
100.4
101.9
Q2 2022
99.3
98.9
Q1 2022
98.1
97.2
Homes sold each year in Aravaca, since 2016
246homes sold in 2025
up 0.8%in a year
Registered sales, second-hand and new. 44 of them were new-build. Aravaca is 19.6% of Moncloa-Aravaca’s sales.
2025Homes sold246Share of Moncloa-Aravaca19.6%
0
400
800 homes
2016201920222025
201620202025
201620202025
Homes sold each year in Aravaca, since 2016
Year
Sold
Of Moncloa-Aravaca
2025
246
19.6%
2024
244
18.4%
2023
200
18.6%
2022
121
10.2%
2021
201
15.8%
2020
195
20.8%
2019
205
20.0%
2018
521
32.4%
2017
600
34.7%
2016
310
24.7%
What tenants pay on existing leases in Moncloa-Aravaca
€15.50per m² a month
up 4.7%in a year
Median rent on all leases declared in 2024, flats only. It moves slower than asking rents. The shaded band holds the middle half of leases.
What tenants pay on existing leases in Moncloa-AravacaWhat tenants pay on existing leases in Moncloa-Aravaca. Moncloa-Aravaca: median, with the middle half of leases beneath
Year
Moncloa-Aravaca
Middle half
Madrid
2024
€15.50€12.64–€19.13
€12.64–€19.13
€13.97
2023
€14.81€12.10–€18.16
€12.10–€18.16
€13.30
2022
€14.14€11.59–€17.26
€11.59–€17.26
€12.77
2021
€13.61€11.11–€16.67
€11.11–€16.67
€12.31
2020
€13.47€10.81–€16.61
€10.81–€16.61
€12.12
2019
€13.25€10.66–€16.35
€10.66–€16.35
€11.86
2018
€12.13€9.70–€15.12
€9.70–€15.12
€10.83
2017
€11.56€9.33–€14.38
€9.33–€14.38
€10.36
2016
€11.19€8.99–€13.83
€8.99–€13.83
€10.03
2015
€10.88€8.71–€13.52
€8.71–€13.52
€9.85
2014
€10.86€8.53–€13.46
€8.53–€13.46
€9.80
2013
€11.03€8.47–€13.73
€8.47–€13.73
€10.00
2012
€11.48€8.96–€14.37
€8.96–€14.37
€10.58
2011
€11.60€9.09–€14.61
€9.09–€14.61
€10.84
Coming
Asking prices of the homes we track, week by week
Arrives in mid-November 2026
We began recording every Monday on 21 September 2026. A line needs about eight weekly points. The change on the quarter follows around 21 December, and on the year in September 2027. It will sit beside the official index, never merged with it: ours is asking prices in the segment we track, not sales.
Coming, from: Frankly’s weekly snapshot of the listings we track. Nothing here is estimated.
Homes in Aravaca
Asking prices from the agencies we track, lowest against fair value first. Open a home for the full price check.
The verified agent can tell you what the figures above leave out: works planned on a building, how a street feels at night, and what a seller here is likely to accept.
An independent buyer’s agent Frankly has verified. 30 minutes, free, no obligation. Paid by you, not by the seller.
How we got these numbers
Schools, metro and parks · Aravaca
Every list in this section, where it comes from and how each item was placed in its barrio.
Schools
11
Measures
Primary and secondary schools in the Comunidad de Madrid directory that are open: público, concertado, privado and foreign-curriculum.
Source
Comunidad de Madrid, Consejería de Educación, Centros educativos de la Comunidad de Madrid. Ayuntamiento de Madrid, Centros educativos en Madrid (cross-check of school barrios).
Period
Retrieved 30 September 2026
Method
Listed as published; duplicates by name removed.
Kind of figure
We counted this
Metro stations
1
Measures
Metro and Metro Ligero stations with a street entrance inside the barrio.
Source
Consorcio Regional de Transportes de Madrid (CRTM), Datos abiertos: Elementos de la Red de Metro (M4_Estaciones). Consorcio Regional de Transportes de Madrid (CRTM), Datos abiertos: Elementos de la Red de Metro Ligero (M10_Estaciones). Consorcio Regional de Transportes de Madrid (CRTM), Datos abiertos: Elementos de la Red de Metro (M4_Accesos, station entrances). Consorcio Regional de Transportes de Madrid (CRTM), Datos abiertos: Elementos de la Red de Metro Ligero (M10_Accesos, station entrances).
Period
Retrieved 30 September 2026
Method
Listed as published; duplicates by name removed.
Kind of figure
We counted this
Parks and gardens
4
Measures
The city’s principal parks and gardens, 2,000 m² or more where the area is stated, with their area.
Source
Ayuntamiento de Madrid, Principales parques y jardines municipales.
Period
Retrieved 30 September 2026
Method
Listed as published; duplicates by name removed.
Kind of figure
We counted this
Which barrio
Aravaca
Measures
The official barrio each school, park and station sits in.
Source
Ayuntamiento de Madrid (Geoportal), Barrios municipales de Madrid (131 barrios). Ayuntamiento de Madrid, Callejero oficial: direcciones vigentes (cross-check of school and park barrios). Instituto Geográfico Nacional (IGN), CartoCiudad geocoder (only for schools the directory publishes without coordinates).
Period
Retrieved 30 September 2026
Method
Each item’s own coordinates are tested against the city’s official barrio boundaries; an item is dropped when the city’s address register puts its address in another barrio. A station counts in every barrio where one of its street entrances is. No distances are measured.
Kind of figure
We calculated this
Attribution
Ayuntamiento de Madrid, datos.madrid.es (CC BY 4.0).
Comunidad de Madrid, datos.comunidad.madrid (CC BY 4.0).
Powered by CRTM (crtm.es), retrieved 30 September 2026.
CartoCiudad CC BY 4.0 ign.es.
How we got these numbers
Neighbourhood · Aravaca
Every figure on this card: what it measures, where it comes from, and what we did to it. Figures cover the official barrio.
Household income
€83,039
Measures
The average yearly net income per household living in Aravaca, against the same figure for Madrid city (€49,916).
Source
INE, Household Income Distribution Atlas (ADRH).
Period
2023. Yearly. Each edition covers the income year about two years earlier.
Method
ADRH mean weighted by households (ADRH population ÷ household size) over 16 of 16 census sections, assigned to barrios by code match against padrón sections of 2026-10-01.
Kind of figure
We calculated this, from official records
Population
28,183 · down 1.0%
Measures
People registered as living in Aravaca, and the change on a year earlier.
Source
Ayuntamiento de Madrid, Padrón: population by district and barrio on 1 January.
Period
Jan 2026. Yearly, residents on 1 January; published mid-year.
Method
None beyond the year-on-year change.
Kind of figure
Official record
Average age
41.9
Measures
The average age of registered residents, against Madrid city (44.1, Oct 2026).
Source
Ayuntamiento de Madrid, Padrón: residents by census section, age and nationality (monthly).
Period
Oct 2026. Monthly snapshot of the register.
Method
Mean of single-year ages over 16 census sections, padrón 2026-10-01; 100 and over counted as 100.
Kind of figure
Official record
Aged 65 or over
19.1%
Measures
The share of registered residents aged 65 or over, against Madrid city (20.6%, Oct 2026).
Source
Ayuntamiento de Madrid, Padrón: residents by census section, age and nationality (monthly).
Period
Oct 2026. Monthly snapshot of the register.
Method
Residents aged 65 or over ÷ residents over 16 census sections, padrón 2026-10-01.
Kind of figure
Official record
Registered unemployment
3.2%
Measures
People registered as unemployed, as a share of the working-age population, against Madrid city (5.8%, Feb 2026). Not the survey (EPA) rate.
Source
Ayuntamiento de Madrid, District and barrio indicator panel.
Period
Feb 2026. Yearly panel; unemployment is the February count.
Method
February registered unemployed ÷ padrón residents aged 16–64.
Kind of figure
Official record
Years of income to buy
12.2 years
Measures
How many years of an average household’s income the typical home sold here costs.
Source
Ayuntamiento de Madrid × Colegio de Registradores, Registered home sales by district and barrio, 2007→ (city data bank); Comunidad de Madrid, Second-hand home price index (IPVCM), base 2022, by Madrid district; Ayuntamiento de Madrid, District and barrio indicator panel; INE, Household Income Distribution Atlas (ADRH).
Period
Sold price at Q2 2026 prices; size 2025; income 2023.
Method
Brought-forward sold price per m² (€6,314, every registered sale) × average size of homes sold (161.1 m², 2025) ÷ average net household income (€83,039, 2023) ≈ 12.2 years. Madrid, the same way: 9.7 years. It uses the price of every registered sale here, not only in the barrios of the homes we track: it is about the typical home sold, not our listings.
Kind of figure
We calculated this, from official records
Mortgage defaults and homes occupied without a lease
No grade
Measures
Why this page gives no grade for defaults or homes occupied without a lease (ocupación).
Source
Only province-level data exists: Banco de España (delinquency), INE Ejecuciones hipotecarias (foreclosures), Ministerio del Interior (reported occupation without a lease).
Period
—
Method
A district grade would be invented precision, so we don’t make one.
Kind of figure
Nobody publishes this
Attribution
Elaboración propia con datos extraídos del sitio web del INE: www.ine.es, 2023. Licence CC BY 4.0.
Origen de los datos: Ayuntamiento de Madrid, 2025–2026. Licence CC BY 4.0.
Comunidad de Madrid, IPVCM, Q2 2026. Licence CC BY 4.0.
Source: Colegio de Registradores, via Ayuntamiento de Madrid statistics.
How we got these numbers
Sale · Aravaca
Every figure on this card: what it measures, where it comes from, and what we did to it.
Asking price per m²
€6,469
Measures
The middle asking price per m² of the 199 homes for sale in Aravaca today. Half ask less, half ask more.
Source
Listings published by 16 agencies, which Frankly reads every day.
Period
Today. Updates daily.
Method
Asking price divided by built area for each home, then the middle value.
Kind of figure
Listing data, not verified
Madrid, homes we track
€11,329
Measures
The same middle asking price per m², across the 6,994 homes we track in Madrid.
Source
The same agency listings.
Period
Today. Updates daily.
Method
As above, over all Madrid districts we cover.
Kind of figure
Listing data, not verified
Price trend
up 14.3% · up 3.3%
Measures
How the prices of all second-hand homes sold in Aravaca changed: over a year, and over the last quarter.
Source
Comunidad de Madrid, Second-hand home price index (IPVCM), base 2022, by Madrid district.
Period
Q2 2026. Quarterly, about two months after the quarter ends.
Method
None. We show the index's own published changes.
Kind of figure
Official record (the quarterly change is calculated by us)
Homes here sold for about
€6,300/m²
Measures
What second-hand homes sold for per m² in registered sales, in the same barrios as the homes we track, brought up to the latest quarter. Each barrio counts as much as it has homes we track.
Source
Ayuntamiento de Madrid × Colegio de Registradores, Registered home sales by district and barrio, 2007→ (city data bank). Barrio table, second-hand homes. Brought forward with Comunidad de Madrid, Second-hand home price index (IPVCM), base 2022, by Madrid district.
Period
2025 average, brought up to Q2 2026. Yearly, covering the previous year's registered sales.
Method
Every home we track here is in barrio Aravaca, so this is the barrio's own registered price: €5,603 × 1.127 ≈ €6,314, shown as €6,300. We bring it forward because a 2025 price read today would look cheap.
Kind of figure
Official record, brought forward by us
Asking vs sold
+3%
Measures
How the asking prices of the homes we track compare with what homes sold for in the same barrios. A description of our listings, not a verdict.
Source
The asking price and the sold price above.
Period
Today’s asking prices against Q2 2026 sold prices.
Method
€6,469 ÷ €6,300 − 1 = 2.7%, shown as about 3%. The sold price is weighted to the barrios the homes we track are in, so the difference in location is taken out. What is left is the gap between asking and selling, plus any difference in the homes themselves within a barrio.
Kind of figure
We calculated this
Priced below our fair value
22%
Measures
The share of homes for sale that ask less per m² than three in four similar homes nearby.
Source
Frankly’s fair-value comparison, over the listings above.
Period
Today. Updates daily.
Method
Each home is compared with similar homes in the district by size, bedrooms and condition. 25 of the 116 homes we can compare fall in the cheapest quarter.
Kind of figure
We calculated this
Typical time advertised
62 days
Measures
The middle number of days the homes for sale have been advertised.
Source
Frankly’s daily record of each listing.
Period
Today. Updates daily.
Method
Days since we first saw each listing, then the middle value. A home that is taken down and listed again starts from zero.
Kind of figure
We counted this
Have cut their price
15%
Measures
The share of homes for sale whose asking price has dropped at least once.
Source
Frankly’s price history for each listing.
Period
Today. Updates daily.
Method
29 of the 199 homes have at least one recorded drop.
Kind of figure
We counted this
Attribution
Comunidad de Madrid, IPVCM, Q2 2026. Licence CC BY 4.0.
Source: Colegio de Registradores, via Ayuntamiento de Madrid statistics.
Listing prices belong to the agencies that publish them. Frankly does not verify them.
How we got these numbers
Rent · Aravaca
Every figure on this card: what it measures, where it comes from, and what we did to it.
Asking rent per m²
€20.5
Measures
The middle monthly asking rent per m² of the 17 homes to rent in Aravaca today.
Source
Listings published by 21 agencies, which Frankly reads every day.
Period
Today. Updates daily.
Method
Monthly rent divided by built area for each home, then the middle value.
Kind of figure
Listing data, not verified
Madrid, homes we track
€31.3
Measures
The same middle asking rent per m², across the 1,161 homes to rent we track in Madrid.
Source
The same agency listings.
Period
Today. Updates daily.
Method
As above, over all Madrid districts we cover.
Kind of figure
Listing data, not verified
Rent trend
little change −0.5%
Measures
How the asking rents of the homes we track move, comparing the same homes over time. Our own record, not the whole market.
Source
Frankly’s weekly snapshots of the rentals above.
Period
Since Sep 2026. Updates weekly.
Method
Each week we take the rent change of the homes listed in both that snapshot and the one before, and chain those changes over the period.
Kind of figure
We calculated this
What tenants pay on existing leases, per m² a month
€15.5 per m²
Measures
What tenants actually pay, from the rents landlords declare in their income-tax returns: flats let as a main residence, lets to relatives excluded. It arrives about two years late. Flats in buildings only; houses are a separate series. MIVAU withholds any census section with fewer than 10 lets. Not comparable with the asking rents above: two years apart, and the whole rental market rather than the homes we track. Aravaca has no figure of its own (too few lets, or a census section withheld), so this is Moncloa-Aravaca’s.
Source
MIVAU, State rent reference index (SERPAVI): rents declared in tax returns, by municipality, district and census section.
Period
2024. Yearly. Each edition covers the tax year about two years earlier (the 2026 edition has 2024).
Method
None. We show the median MIVAU publishes.
Kind of figure
Official record
Declared-rent index
up 3.5% that year
Measures
How rents declared for tax changed in Moncloa-Aravaca over 2024: INE’s rental price index, built from the same tax returns. A separate series from the € figure, so the two can differ.
Source
INE, Rental price index (IPVA), base 2015, by municipality and district.
Period
2024. Yearly, in spring, covering the tax year about 17 months earlier (May 2026 published 2024).
Method
None. We show the yearly change INE publishes.
Kind of figure
Official record
To rent now
17
Measures
Homes advertised to rent in Aravaca today.
Source
Listings published by 21 agencies, which Frankly reads every day.
Period
Today. Updates daily.
Method
Counted once each, across agencies.
Kind of figure
We counted this
Typical rent
€4,850 a month
Measures
The middle monthly asking rent. Half ask less, half ask more.
Source
The same agency listings.
Period
Today. Updates daily.
Method
The middle value of the monthly asking rents.
Kind of figure
Listing data, not verified
Typical time listed
48 days
Measures
The middle number of days the homes to rent have been advertised.
Source
Frankly’s daily record of each listing.
Period
Today. Updates daily.
Method
Days since we first saw each listing, then the middle value. A home that is taken down and listed again starts from zero.
Kind of figure
We counted this
Attribution
Elaboración propia con datos extraídos del sitio web del INE: www.ine.es, 2024. Licence CC BY 4.0.
Source: Ministerio de Vivienda y Agenda Urbana, SERPAVI, 2011–2024 database (file last updated 9 July 2026); figures for 2024. Reused under the ministry’s terms, which require this citation.
Listing prices belong to the agencies that publish them. Frankly does not verify them.
How we got these numbers
Homes · Aravaca
Every figure in this section: what it measures, where it comes from, and what we did to it.
Homes on this page
199 for sale · 16 agencies
Measures
Every home advertised in Aravaca today, and how many agencies publish them. The header counts the same homes.
Source
Listings published by 16 agencies, which Frankly reads every day.
Period
Today. Updates daily.
Method
Each home is counted once, even when more than one agency advertises it.
Kind of figure
We counted this
Price, €/m², m², beds
per row
Measures
What each agency advertises.
Source
Listings published by 21 agencies, which Frankly reads every day.
Period
Today. Updates daily.
Method
None, except €/m²: price divided by built area.
Kind of figure
Listing data, not verified
Asking price per m²
per row
Measures
Asking price divided by built area for each home, then the middle value.
Source
The same agency listings.
Period
Today. Updates daily.
Method
Asking price divided by built area for each home, then the middle value.
Kind of figure
We calculated this
Verdict and vs fair
per row
Measures
Where each asking price sits against similar homes nearby, and by how much. Where each rent sits against similar flats to let nearby.
Source
Frankly’s fair-value comparison, over the listings above.
Period
Today. Updates daily.
Method
Each home is compared with similar homes nearby by size, bedrooms and condition. “Below fair” means cheaper per m² than three in four of them; “Above fair”, dearer than three in four. The % compares the home with their middle price per m². “Typical” is the middle half (25th to 75th percentile) of up to 20 comparable flats: same bedrooms where we have at least three, otherwise similar size. With fewer than three we show no read.
Kind of figure
We calculated this
The barrio on each card
per row
Measures
The official barrio a listing sits in, from the area its agency tags it with; the district’s name when that area can’t be placed in one barrio (a street that crosses barrios, a landmark).
Source
The same agency listings.
Period
Today. Updates daily.
Method
Each tag is matched to the city’s street register: a tag counts only when all of it lies in one official barrio. Homes that can’t be placed appear under “All” only.
Kind of figure
We calculated this
Attribution
Listing prices belong to the agencies that publish them. Frankly does not verify them.
How we got these numbers
The market over time · Aravaca
Every figure in this section: what it measures, where it comes from, and what we did to it.
Registered sale price per m²
€5,603 per m²
Measures
Average price per m² of second-hand homes sold, from the property registries, by year of registration.
Source
Ayuntamiento de Madrid × Colegio de Registradores, Registered home sales by district and barrio, 2007→ (city data bank).
Period
2016–2025. Yearly, covering the previous year's registered sales.
Method
None. The yearly figure as published.
Kind of figure
Official record
Official price index
+50.3% since early 2022
Measures
How sale prices of second-hand homes have moved, as an index where 2022 = 100. An index, not a price. The publisher smooths this district’s series, so single quarters move less than the market underneath. Published only for Moncloa-Aravaca: the index has no barrio level, so Aravaca shows its district.
Source
Comunidad de Madrid, Second-hand home price index (IPVCM), base 2022, by Madrid district.
Period
Q1 2022–Q2 2026. Quarterly, about two months after the quarter ends.
Method
None. The quarterly index as published.
Kind of figure
Official record
Homes sold
246 homes sold in 2025
Measures
All homes sold each year, counted when the sale is registered.
Source
Ayuntamiento de Madrid × Colegio de Registradores, Registered home sales by district and barrio, 2007→ (city data bank).
Period
2016–2025. Yearly, covering the previous year's registered sales.
Method
None. The yearly count as published. Share of Moncloa-Aravaca’s sales: homes sold here ÷ homes sold in Moncloa-Aravaca the same year, 246 ÷ 1,257 = 19.6%.
Kind of figure
Official record
Declared rent
€15.50 per m² a month
Measures
Monthly rent per m² that landlords declare in their tax returns for flats let as a main residence: the median and the middle half.
Source
MIVAU, State rent reference index (SERPAVI): rents declared in tax returns, by municipality, district and census section.
Period
2011–2024. Yearly. Each edition covers the tax year about two years earlier (the 2026 edition has 2024).
Method
None. The median and quartiles MIVAU publishes.
Kind of figure
Official record
Attribution
Comunidad de Madrid, IPVCM, Q2 2026. Licence CC BY 4.0.
Source: Colegio de Registradores, via Ayuntamiento de Madrid statistics.
Source: Ministerio de Vivienda y Agenda Urbana, SERPAVI, 2011–2024 database (file last updated 9 July 2026); figures for 2024. Reused under the ministry’s terms, which require this citation.