Asking price since we first saw it
| Date | Days after first seen | Change | Price |
|---|---|---|---|
| 19 Sep 2026 | 176 | −€30,000 · 4.1% | €695,000 |
| 20 Aug 2026 | 146 | −€114,000 · 13.6% | €725,000 |
| 26 Mar 2026 | first seen | — | €839,000 |

What the advert says
Is this price fair
Asking is €695,000, 20% below what similar homes nearby suggest. The range they point to, and what the gap costs you each month, open with a free account.
See the fair range and the three checks
Free with an account. You get the range similar homes point to, what the gap would cost you each month, and where every number comes from.
Listings that informed this estimate · Chamberí
We compared it with 24 homes on sale in Chamberí, each of 64–91 m². The middle half of them, priced at this flat’s 76 m², gives the fair range above. These are the eight closest in size.
Asking prices, not sale prices · sorted by closest in size
This listing€9,145/m²2-bed penthouse with terrace in Arapiles, Chamberí
76 m² · 2 beds · 2 baths
The home you are looking at
 €10,600/m²
3-bed penthouse with terrace in Nuevos Ministerios, Chamberí
75 m² · 3 beds · 2 baths
Much like this one on the facts listed
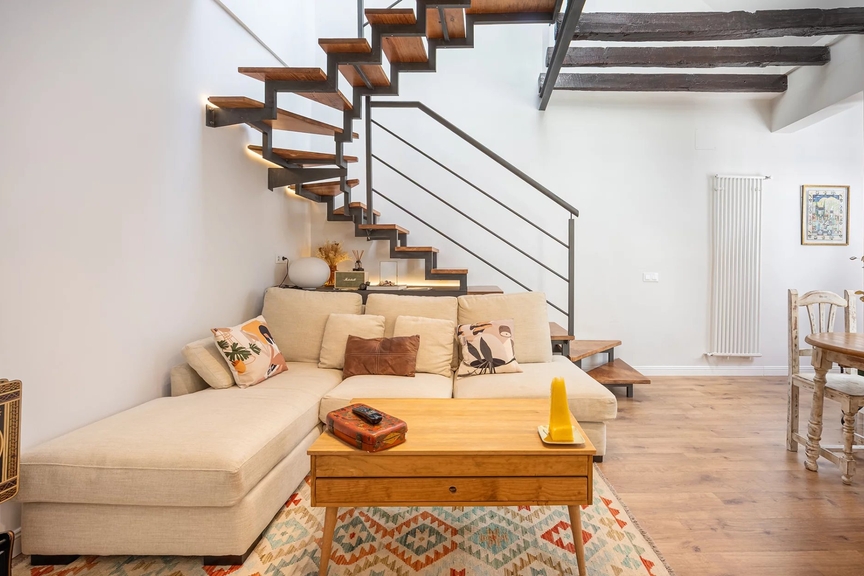 €9,459/m²
Modern 2-bed penthouse in classic building in Chamberí
74 m² · 2 beds · 2 baths
Much like this one on the facts listed
 €11,575/m²
Brand-new 2-bed penthouse with terrace in Chamberí
73 m² · 2 beds · 2 baths
Much like this one on the facts listed
 €11,575/m²
Brand-new 2-bed penthouse with terrace in Chamberí
73 m² · 2 beds · 2 baths
Much like this one on the facts listed
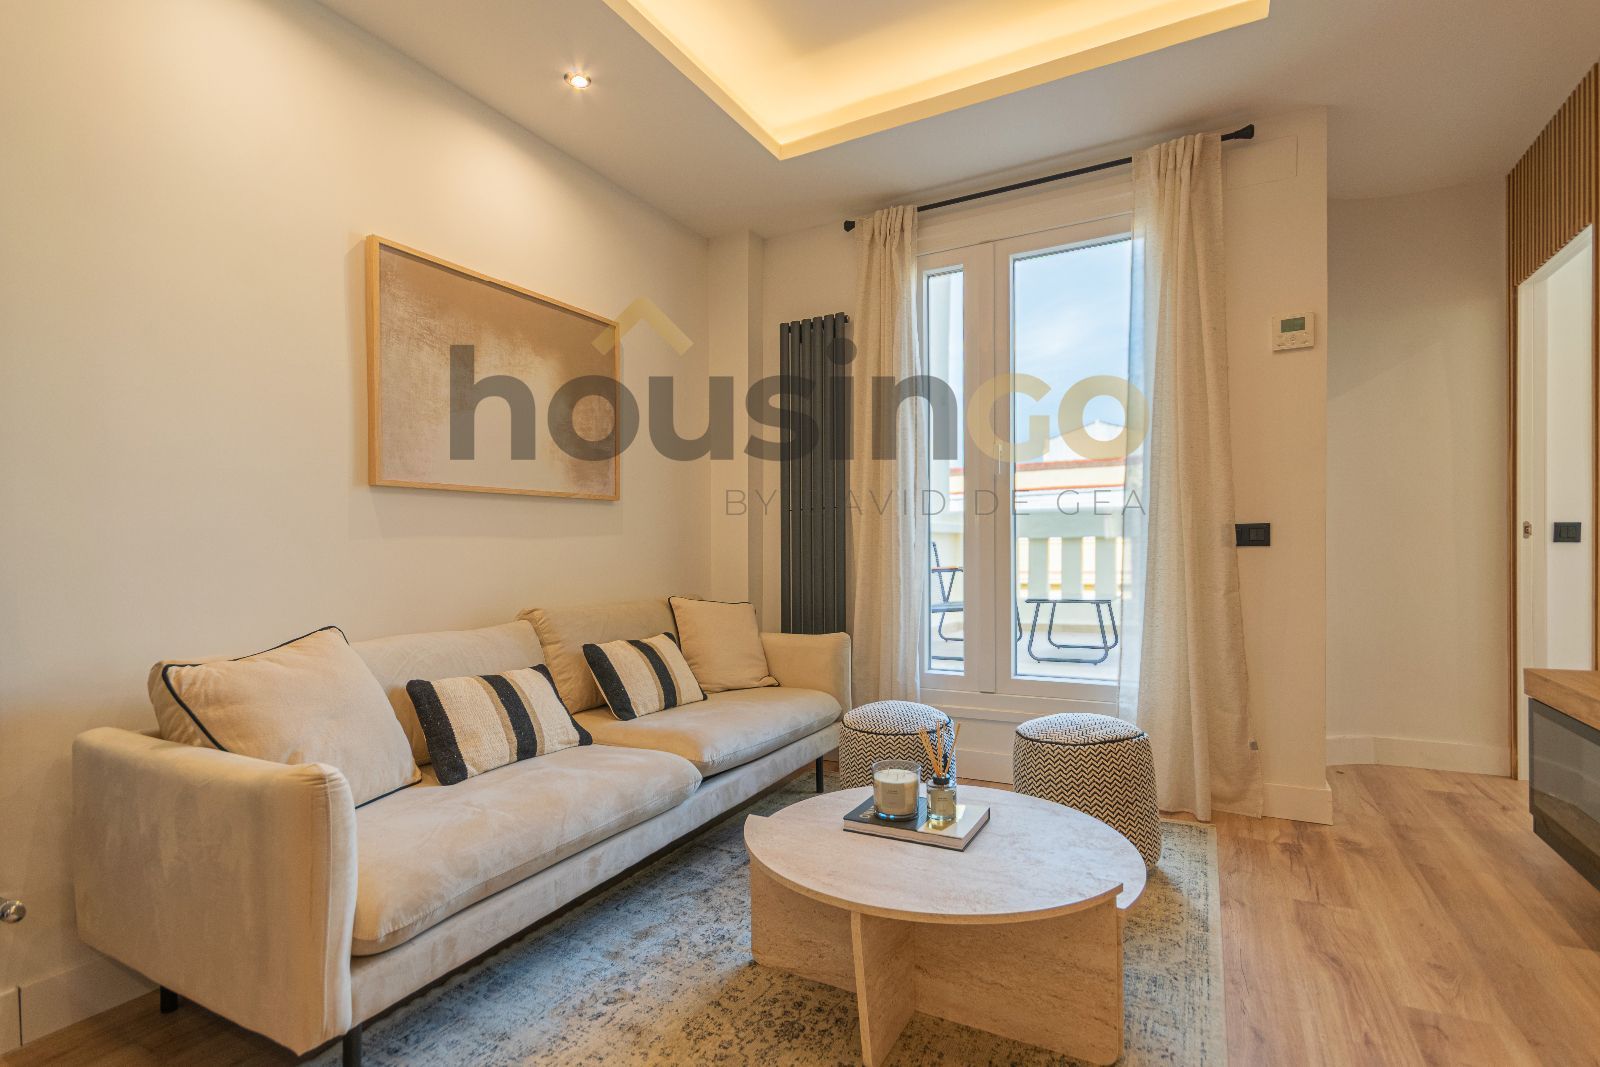 €11,736/m²
2-bed penthouse with terrace in Vallehermoso, Chamberí
72 m² · 2 beds · 2 baths
6th floor, lift
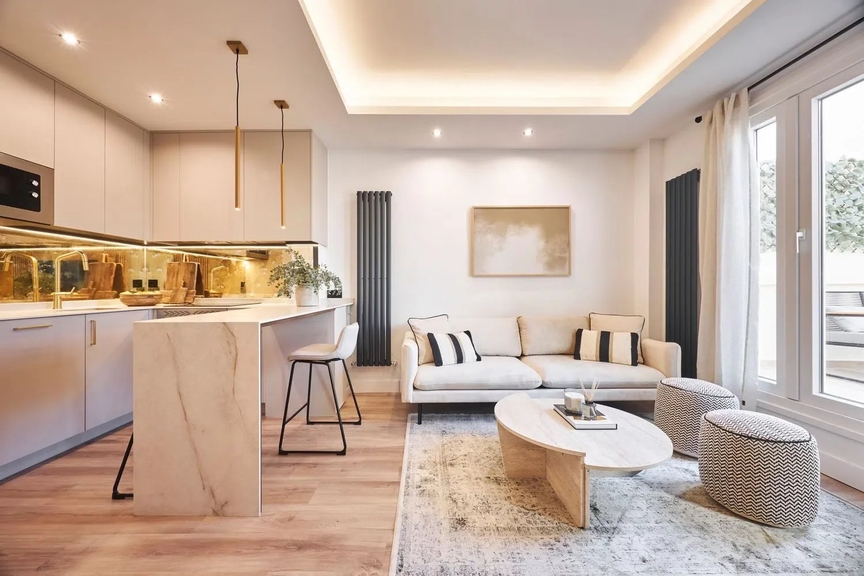 €13,542/m²
Reformed 2-bed penthouse with terrace in Arapiles, Chamberí
72 m² · 2 beds · 2 baths
Exterior
Sunlit 1-bed penthouse with terrace in Trafalgar, Chamberí
80 m² · 1 bed · 1 bath
Exterior · Includes a garage space
 €11,890/m²
3-bed penthouse with terrace in Trafalgar, Chamberí
82 m² · 3 beds · 2 baths
5th floor, lift
If you rented it out as someone’s home
Everything here is long-term residential rent: a lease for someone’s home, never a tourist or short-stay let. Asking rent is what landlords advertise today. Rent on existing leases is what tenants pay, as recorded in tax returns, and it reaches the statistics about two years later. It runs lower; the yield here is on asking.
Asking rent, yield, running costs and the five-year view for this home.
This home’s asking price
| Date | Days after first seen | Change | Price |
|---|---|---|---|
| 19 Sep 2026 | 176 | −€30,000 · 4.1% | €695,000 |
| 20 Aug 2026 | 146 | −€114,000 · 13.6% | €725,000 |
| 26 Mar 2026 | first seen | — | €839,000 |
Chamberí, for context: 13% of sellers cut their asking price in the past 12 months, typically by about 5%. How sellers negotiate in Chamberí →
The market over time
Chamberí, from official records. Only the 2025 rent point is our estimate; every other line is published data. A ring marks where this home’s asking price sits.
€9,145per m², this home’s asking price
Chamberí’s registered sales averaged €8,230 per m² in 2025, about €8,800 brought forward to this quarter. The ring is this home’s asking price, not a sale. Past rises aren’t assumed in the five-year figures above.
| Year | Chamberí | Madrid |
|---|---|---|
| Today | This home, asking €9,145 | |
| 2025 | €8,230 | €5,334 |
| 2024 | €7,095 | €4,544 |
| 2023 | €6,691 | €4,077 |
| 2022 | €6,159 | €3,966 |
| 2021 | €5,646 | €3,649 |
| 2020 | €5,472 | €3,572 |
| 2019 | €5,551 | €3,473 |
| 2018 | €5,170 | €3,387 |
| 2017 | €4,412 | €2,945 |
| 2016 | €3,838 | €2,638 |
| 2015 | €3,412 | €2,461 |
| 2014 | €3,165 | €2,406 |
| 2013 | €3,093 | €2,383 |
| 2012 | €3,663 | €2,631 |
| 2011 | €4,075 | €3,133 |
| 2010 | €4,279 | €3,301 |
| 2009 | €4,198 | €3,288 |
| 2008 | €4,966 | €3,687 |
| 2007 | €4,800 | €3,860 |
3.1%gross yield in Chamberí, 2024
Rents on existing long-term leases (flats only), over the prices of second-hand homes sold that year. Gross, before costs.
| Year | Chamberí | Madrid |
|---|---|---|
| 2024 | 3.1% | 3.7% |
| 2023 | 3.2% | 3.9% |
| 2022 | 3.3% | 3.9% |
| 2021 | 3.4% | 4.0% |
| 2020 | 3.5% | 4.1% |
| 2019 | 3.4% | 4.1% |
| 2018 | 3.4% | 3.8% |
| 2017 | 3.7% | 4.2% |
| 2016 | 4.1% | 4.6% |
| 2015 | 4.5% | 4.8% |
| 2014 | 4.7% | 4.9% |
| 2013 | 4.9% | 5.0% |
| 2012 | 4.3% | 4.8% |
| 2011 | 3.9% | 4.2% |
1,877homes sold in 2025
Registered sales, second-hand and new. 141 of them were new-build. Chamberí is 4.8% of Madrid’s sales.
| Year | Sold | Of Madrid |
|---|---|---|
| 2025 | 1,877 | 4.8% |
| 2024 | 1,898 | 5.1% |
| 2023 | 1,846 | 5.3% |
| 2022 | 2,068 | 5.1% |
| 2021 | 1,908 | 5.4% |
| 2020 | 1,153 | 4.6% |
| 2019 | 1,692 | 4.9% |
| 2018 | 1,931 | 5.0% |
| 2017 | 2,111 | 5.4% |
| 2016 | 1,839 | 5.8% |
| 2015 | 1,647 | 6.1% |
| 2014 | 1,456 | 6.6% |
| 2013 | 1,093 | 5.4% |
| 2012 | 984 | 4.9% |
| 2011 | 1,158 | 5.2% |
| 2010 | 1,437 | 5.4% |
| 2009 | 1,078 | 5.0% |
| 2008 | 1,334 | 4.7% |
| 2007 | 1,389 | 3.5% |
€18.55per m² a month
Median rent on all leases declared in 2024, flats only. It moves slower than asking rents. The shaded band holds the middle half of leases. The dotted end is our estimate for 2025, not a published figure.
| Year | Chamberí | Middle half | Madrid |
|---|---|---|---|
| 2025 · our estimate | €19.37€18.81–€20.75 | — | €14.41€14.00–€15.44 |
| 2024 | €18.55€14.96–€22.76 | €14.96–€22.76 | €13.97 |
| 2023 | €17.58€14.29–€21.30 | €14.29–€21.30 | €13.30 |
| 2022 | €16.80€13.69–€20.19 | €13.69–€20.19 | €12.77 |
| 2021 | €16.05€12.96–€19.39 | €12.96–€19.39 | €12.31 |
| 2020 | €15.91€12.64–€19.51 | €12.64–€19.51 | €12.12 |
| 2019 | €15.79€12.52–€19.28 | €12.52–€19.28 | €11.86 |
| 2018 | €14.43€11.27–€17.76 | €11.27–€17.76 | €10.83 |
| 2017 | €13.67€10.76–€16.67 | €10.76–€16.67 | €10.36 |
| 2016 | €13.16€10.34–€16.04 | €10.34–€16.04 | €10.03 |
| 2015 | €12.75€9.93–€15.58 | €9.93–€15.58 | €9.85 |
| 2014 | €12.50€9.44–€15.42 | €9.44–€15.42 | €9.80 |
| 2013 | €12.61€9.26–€15.70 | €9.26–€15.70 | €10.00 |
| 2012 | €13.10€9.70–€16.30 | €9.70–€16.30 | €10.58 |
| 2011 | €13.23€9.73–€16.67 | €9.73–€16.67 | €10.84 |
Who buys in this district
Spain’s land registry publishes who completes purchases, by district: where buyers come from, and whether they buy through a company. Names are never included.
Who buys in Chamberí: official figures are on their way.
Coming
Nothing here is estimated. Each figure appears once it is loaded from its source and checked. Buyer figures are published for the whole district, never for a single street or home.
The neighbourhood · Chamberí
This flat is in Arapiles, a barrio (neighbourhood) of the Chamberí district. The people who live here, what homes sell for and what rent costs, each set against Madrid city. Green means up, red means down, blue means little change.
€65,174a year
Household income · Madrid €49,916
Official district, including Almagro
People
€10,143per m²
Madrid, homes we track: €10,903
Price trend
up 10.6%in a yearup 3.9%on the quarter
Official price index · all second-hand sales in the district
What homes here sold for
Homes for sale now
€32.4per m² a month
Madrid, homes we track: €30.6
What tenants pay on existing leases
Homes to rent now
Asking rents are for homes advertised today. What tenants pay on existing leases comes from tax returns, runs about two years behind and is usually lower.
No grade for mortgage defaults or homes occupied without a lease (ocupación), on purpose. Spain publishes both only for the whole province, so a Chamberí grade would be invented precision.
The building itself
Spain’s land registry (the Catastro) records every building’s size, age and use. The first two figures are the agency’s; pull the building’s own record below to check them.
What comes back
Things that would change the deal
None of these are unusual in Spain, and none of them are visible in a photo. Each one changes what you are actually buying.
Sold with a tenant already in it
Vendido con inquilino. You inherit their contract — in Spain that can run five more years at the rent they already pay.
You buy it, the seller keeps living in it
Nuda propiedad, literally “bare ownership”. You own the home but cannot use or let it until the seller dies. Prices look like a bargain for this reason.
Someone is living there without a lease
Vivienda ocupada. Resolving it goes through the courts and can take more than a year. Ask the agency whether the home is empty.
Being sold at auction
Subasta. You usually cannot view it first, and you may take on the previous owner’s debts on the property.
No first-occupancy licence
Sin licencia de primera ocupación. The building cannot legally be lived in yet, which also means most banks will not lend on it.
A big repair bill on the way
Derrama (a one-off levy the building charges owners for big repairs, such as a new lift or facade). Ask for the last three years of owners’ meeting minutes (actas de la comunidad) to see what has been agreed.
Tourist lets in this district
Vivienda de uso turístico (a licensed tourist flat). The city’s Plan Especial de Hospedaje restricts new ones in parts of this district.
We do not yet read listings for these. Ask the agency before you offer; your lawyer confirms each one in the nota simple (the land-registry extract).
It tells you what to ask, what to budget, and what a fair number looks like. The verified agent can tell you the rest.
An independent buyer’s agent Frankly has verified. 30 minutes, free, no obligation. Paid by you, not by the seller.
How we got these numbers
Every figure in this section: what it measures, where it comes from, and what we did to it.
Attribution
Listing prices belong to the agencies that publish them. Frankly does not verify them.
How we got these numbers
Every figure in this section: what it measures, where it comes from, and what we did to it.
Attribution
Listing prices belong to the agencies that publish them. Frankly does not verify them.
How we got these numbers
We compared it with 24 homes on sale in Chamberí, each of 64–91 m². The middle half of them, priced at this flat’s 76 m², gives the fair range above. These are the eight closest in size. Every figure in this section: what it measures, where it comes from, and what we did to it.
Attribution
Listing prices belong to the agencies that publish them. Frankly does not verify them.
How we got these numbers
Every figure on this card: what it measures, where it comes from, and what we did to it. Figures cover the official district, which includes Almagro.
Attribution
Elaboración propia con datos extraídos del sitio web del INE: www.ine.es, 2023. Licence CC BY 4.0.
Origen de los datos: Ayuntamiento de Madrid, 2025–2026. Licence CC BY 4.0.
Comunidad de Madrid, IPVCM, Q2 2026. Licence CC BY 4.0.
Source: Colegio de Registradores, via Ayuntamiento de Madrid statistics.
How we got these numbers
Every figure on this card: what it measures, where it comes from, and what we did to it.
Attribution
Comunidad de Madrid, IPVCM, Q2 2026. Licence CC BY 4.0.
Source: Colegio de Registradores, via Ayuntamiento de Madrid statistics.
Listing prices belong to the agencies that publish them. Frankly does not verify them.
How we got these numbers
Every figure on this card: what it measures, where it comes from, and what we did to it.
Attribution
Elaboración propia con datos extraídos del sitio web del INE: www.ine.es, 2024. Licence CC BY 4.0.
Source: Ministerio de Vivienda y Agenda Urbana, SERPAVI, 2011–2024 database (file last updated 9 July 2026); figures for 2024. Reused under the ministry’s terms, which require this citation.
Listing prices belong to the agencies that publish them. Frankly does not verify them.
How we got these numbers
Every figure in this section: what it measures, where it comes from, and what we did to it.
Attribution
Listing prices belong to the agencies that publish them. Frankly does not verify them.
How we got these numbers
Every figure in this section: what it measures, where it comes from, and what we did to it.
Attribution
Source: Colegio de Registradores, via Ayuntamiento de Madrid statistics.
Source: Ministerio de Vivienda y Agenda Urbana, SERPAVI, 2011–2024 database (file last updated 9 July 2026); figures for 2024. Reused under the ministry’s terms, which require this citation.
INE, consumer price index (table 76134) and IRAV rent-update index (table 72975). Licence CC BY 4.0.