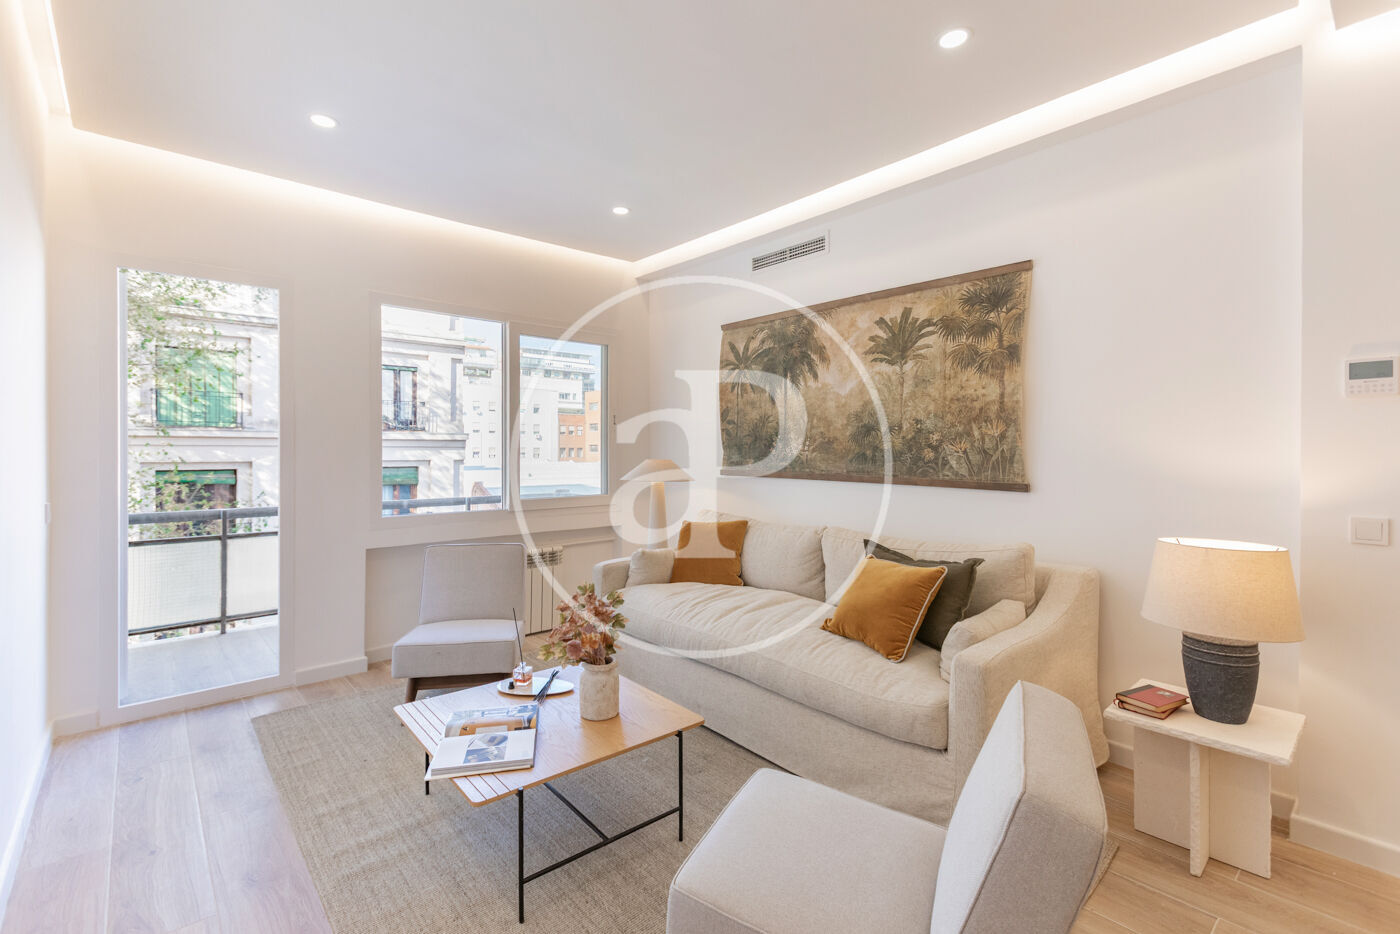
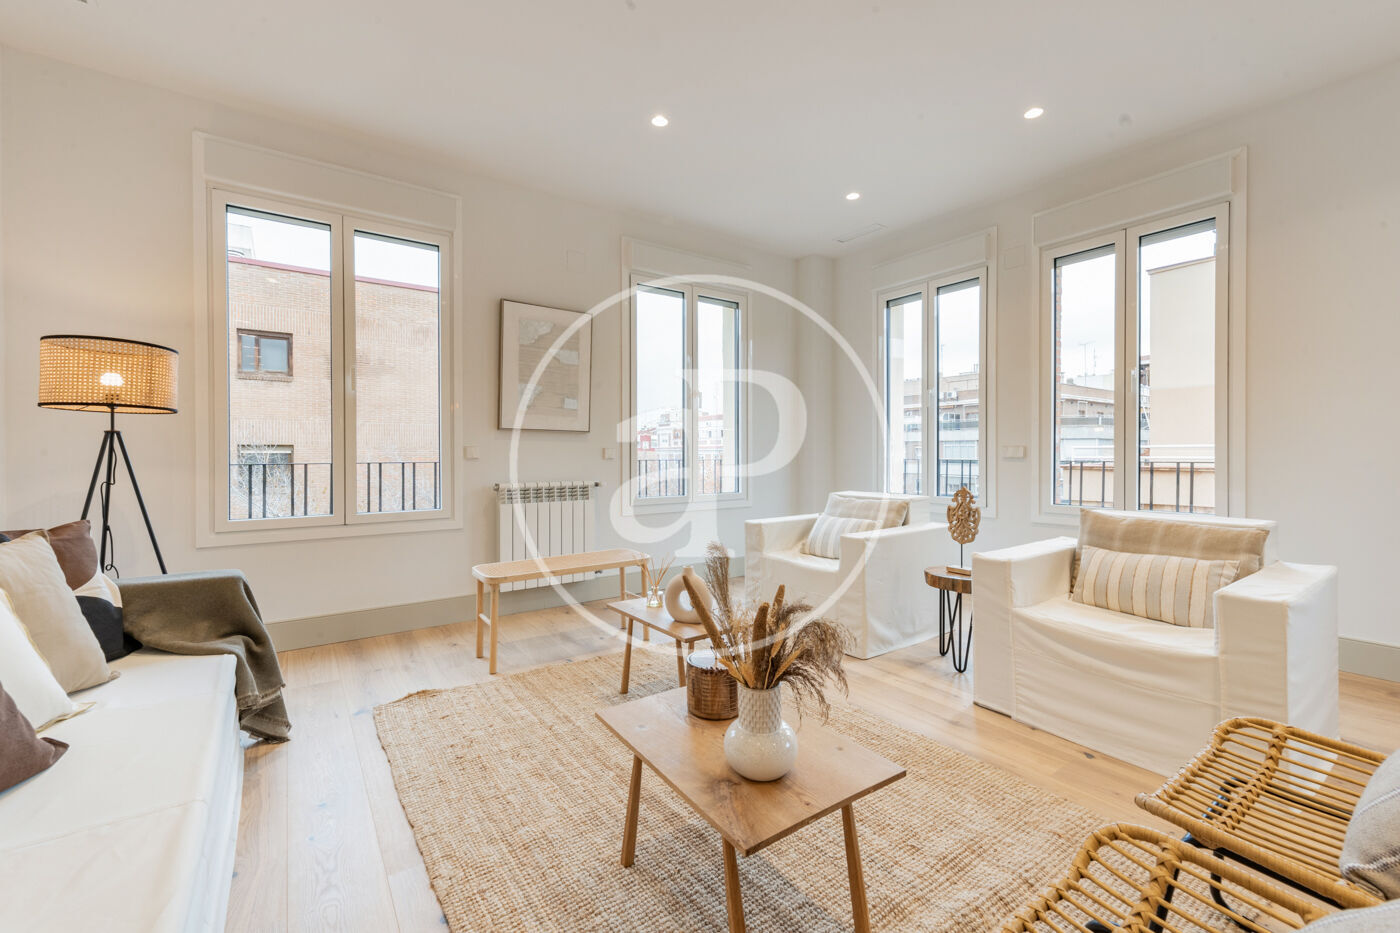
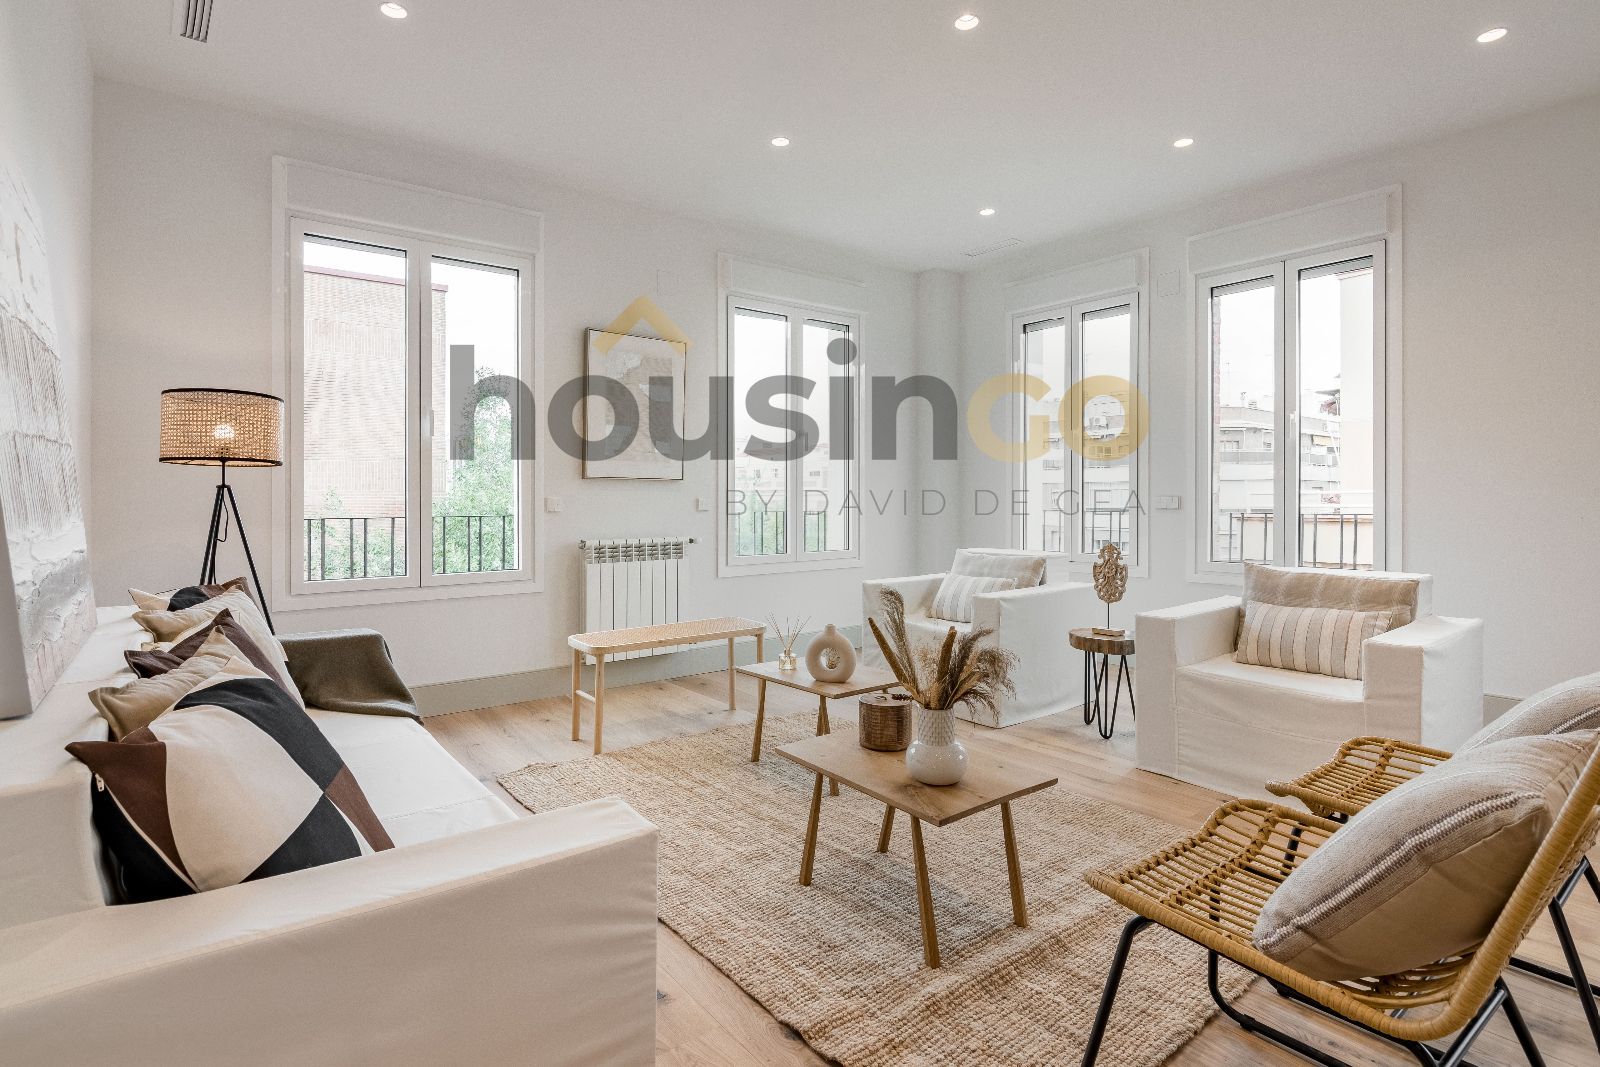
Asking is €1,250,000, 10% below what similar homes nearby suggest. The range they point to, and what the gap costs you each month, open with a free account.
Fair value range€0,000,000 – €0,000,000
Asking price€0,000,000
+€00,000€000,000€0,000,000
Against homes on sale nearby
0% over
Placeholder text under the locked card. The figures open with a free account.
Against official sale records
Registered prices are on their way.
What homes in Chamberí actually sold for, from the land registry. It appears here once it is loaded and checked.
Against the rent it could earn
0.0% gross yield
Placeholder text under the locked card. The figures open with a free account.
Homes like it say the price is about right.
It sits inside the range the middle half of similar homes suggest.
See the fair range and the three checks
Free with an account. You get the range similar homes point to, what the gap would cost you each month, and where every number comes from.
We compared it with 94 homes on sale in Chamberí, each of 136–200 m². The middle half of them, priced at this flat’s 167 m², gives the fair range above. These are the eight closest in size.
Asking prices, not sale prices · sorted by closest in size
1–4 of 91 of 9
This listing€7,485/m²
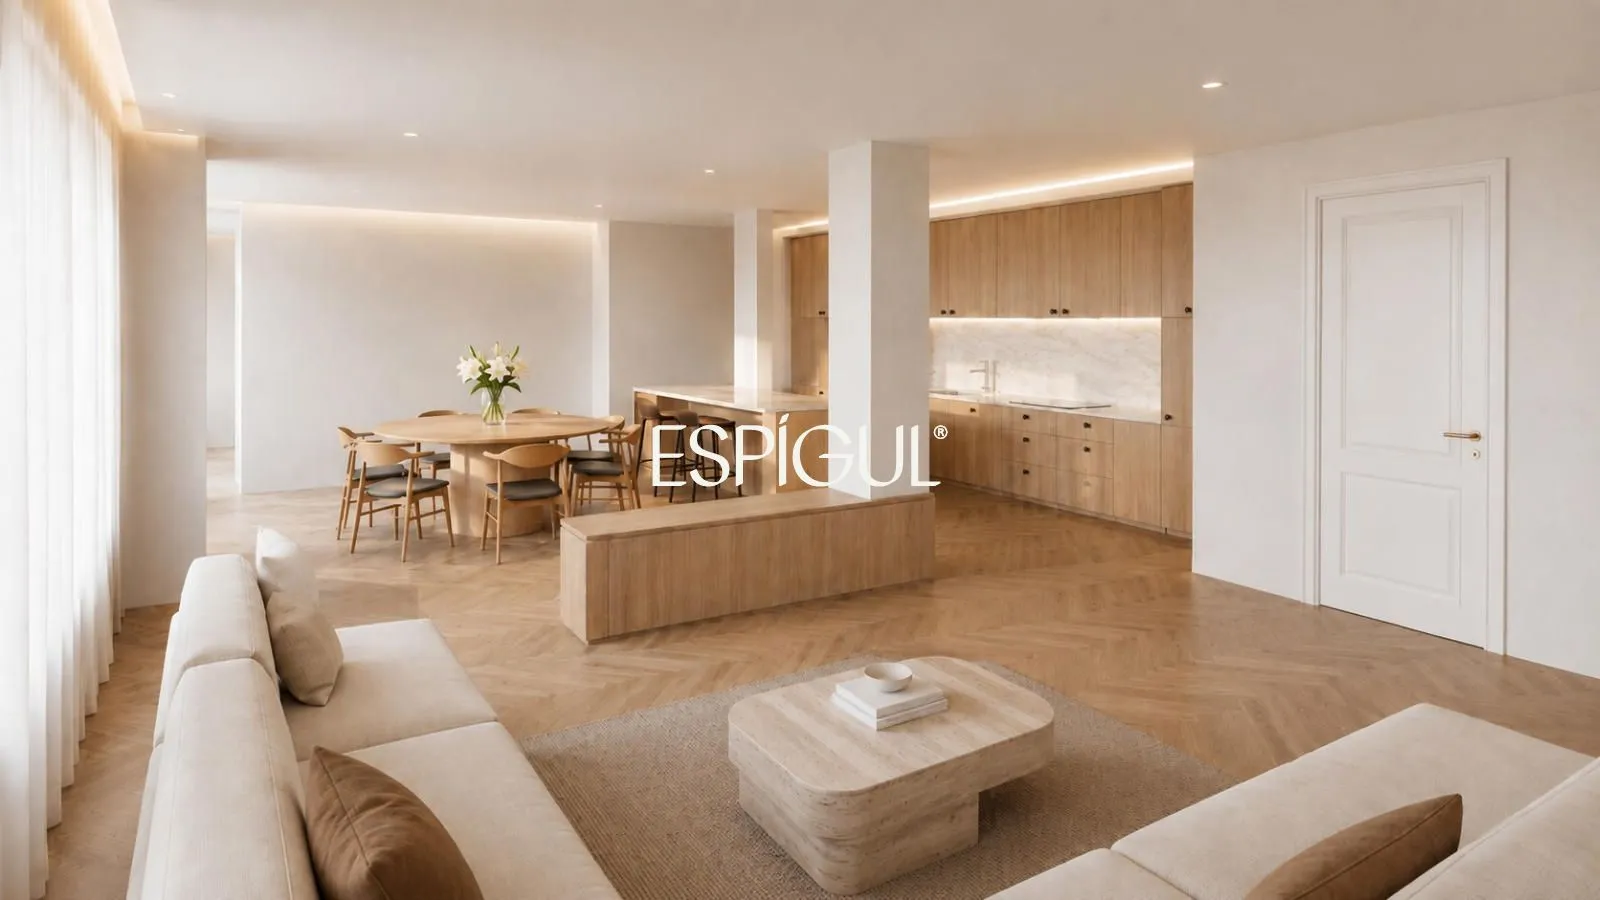
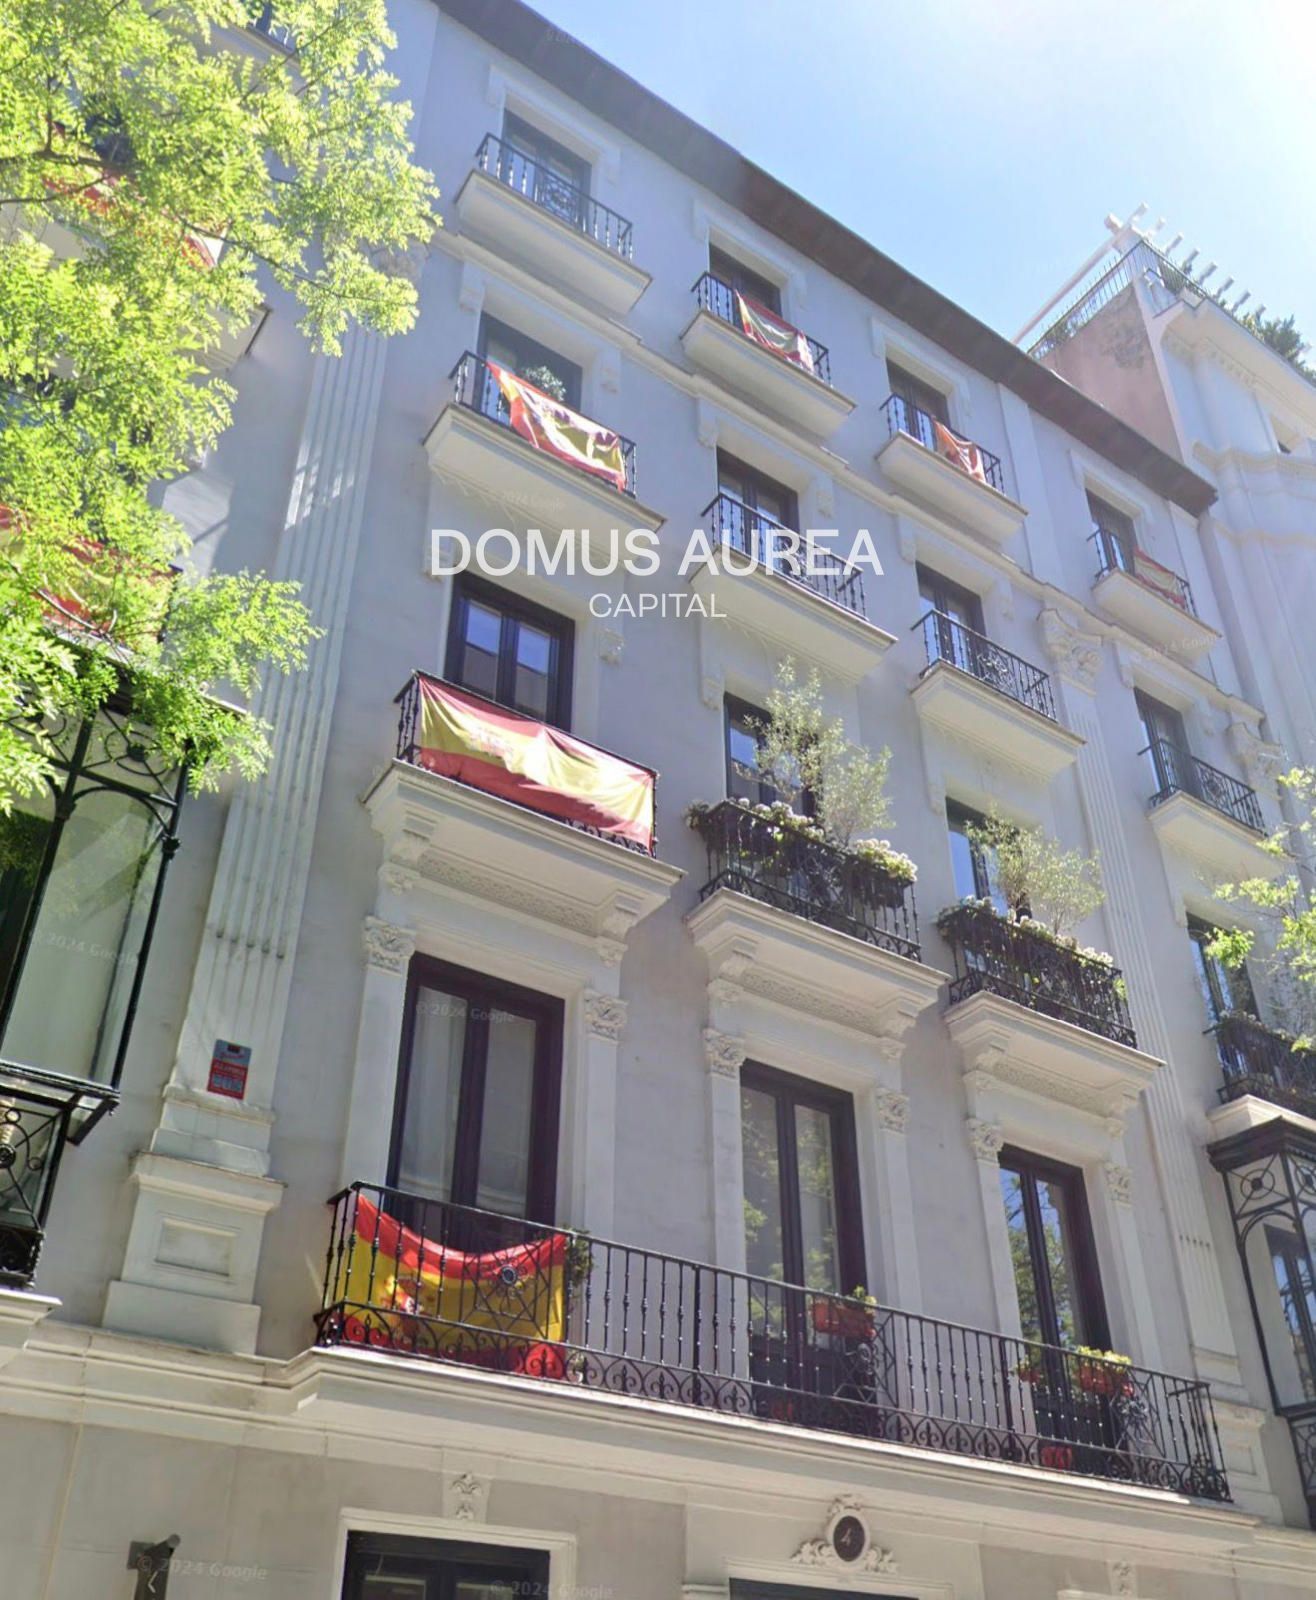
Bright 4-bed apartment with parking in Ríos Rosas, Chamberí
Asking rent is what landlords advertise today. Declared rent is what tenants report for tax, and it reaches the statistics about two years later. Declared runs lower; the yield here is on asking.
The rental numbers come with the search pass.
Asking rent, yield, running costs and the five-year view for this home.
Room to negotiate
Most sellers here don’t cut.
We watch every home in Chamberí until it stops being advertised, and record each price change on the way. Most leave at the price they started with.
87%kept their first price
The 13% that did cut came down a typical 5.2%, about €65,000 on this price. Asking prices, not sale prices.
This home
advertised for 0 days, no price change yet
0 days · no cut
283homes left the marketin Chamberí, past 12 months
13%cut the price first36 of those 283
38 daystypical time advertisedhalf left sooner, half later
A home disappearing usually means it sold. It can also mean the owner gave up or changed agency, and some agencies never take listings down at all. We cannot tell those apart, so we will not show you a sale price we did not see.
Who buys in this district
Who buys here, and how they hold it.
Spain’s land registry publishes who completes purchases, by district: where buyers come from, and whether they buy through a company. Names are never included.
BuyersChamberí district
Who buys in Chamberí: official figures are on their way.
Coming
Buyers from outside Spain
Buying through a company
How long owners keep a home
Nothing here is estimated. Each figure appears once it is loaded from its source and checked. Buyer figures are published for the whole district, never for a single street or home.
The neighbourhood · Chamberí
Chamberí: who lives here, what homes sell for, what they rent for.
This flat is in Ríos Rosas, a barrio (neighbourhood) of the Chamberí district. Each card compares Chamberí with Madrid city. Green means up, red means down, blue means little change.
Neighbourhood
€65,174household income a yeara year
Madrid €49,916Household income · Madrid €49,916
Official district, including Almagro
People
Population
down 1.6% in a year
141,522
Average age
Madrid 44.2
45.9
Aged 65 or over
Madrid 20.7%
24.7%
Registered unemployment
Madrid 5.8%
4.0%
Years of income to buy
average-size home (99 m²) ÷ household income · Madrid 9.8
13.8 years
SaleChamberí · askingasking
€10,215per m²
Madrid, homes we track: €11,013
Price trend
up 10.6%in a year·up 3.9%on the quarter
Official price index · all second-hand sales in the district
What homes here sold for
Homes here sold for about
registered sales in the barrios where the homes we track are, brought up to this quartersame barrios as the homes we track
€8,850/m²
Asking vs sold
Homes we track ask about 15% more than recorded sales in the same barrios.about 15% more, same barrios
No grade for mortgage defaults or squatting (okupación), on purpose. Spain publishes both only for the whole province, so a Chamberí grade would be invented precision.
The building itself
What the advert says about the building, and how to check it.
Spain’s land registry (the Catastro) records every building’s size, age and use. The first two figures are the agency’s; pull the building’s own record below to check them.
1963the year it was builtas the listing states
—lift not statednot stated in the listing
What comes back
Built areathe Catastro’s figure, against the advert’s 167 m²
—
Year built
—
Useresidential, office, shop…
—
Homes in the buildingand other units
—
This homefloor and door
—
Cadastral reference20 characters
—
Things that would change the deal
Spanish situations that catch foreign buyers out.
None of these are unusual in Spain, and none of them are visible in a photo. Each one changes what you are actually buying.
Sold with a tenant already in it
Vendido con inquilino. You inherit their contract — in Spain that can run five more years at the rent they already pay.
Ask the agency
You buy it, the seller keeps living in it
Nuda propiedad, literally “bare ownership”. You own the home but cannot use or let it until the seller dies. Prices look like a bargain for this reason.
Ask the agency
Someone is living there without permission
Okupas. Removing them goes through the courts and can take well over a year.
Ask the agency
Being sold at auction
Subasta. You usually cannot view it first, and you may take on the previous owner’s debts on the property.
Ask the agency
No first-occupancy licence
Sin licencia de primera ocupación. The building cannot legally be lived in yet, which also means most banks will not lend on it.
Ask the agency
Tourist lets in this district
Vivienda de uso turístico (a licensed tourist flat). The city’s Plan Especial de Hospedaje restricts new ones in this district.
Restricted here
We do not yet read listings for these. Ask the agency before you offer; your lawyer confirms each one in the nota simple (the land-registry extract).
None of this tells you whether to buy it.
It tells you what to ask, what to budget, and what a fair number looks like. The verified agent can tell you the rest.
An independent buyer’s agent Frankly has verified. 30 minutes, free, no obligation. Paid by you, not by the seller.
How we got these numbers
Is this price fair? · This home
Every figure in this section: what it measures, where it comes from, and what we did to it.
Asking price
€1,250,000
Measures
The price the agency is asking for this home, as advertised.
Source
The listing, published by the agency and read by Frankly every day.
Period
Today. Updates daily.
Method
None.
Kind of figure
Listing data, not verified
The page header
10% below our fair value
Measures
The same comparison as “Against homes on sale nearby”, shown in the header at the top of the page.
Source
Frankly’s fair-value comparison, over the listings above.
Period
Today.
Method
As above.
Kind of figure
We calculated this
What this exact home last sold for
—
Measures
Spain publishes no sale price for a single home, only averages by barrio and district, which is why the check above uses Ríos Rosas’s.
Source
—
Period
—
Method
—
Kind of figure
Nobody publishes this
Attribution
Listing prices belong to the agencies that publish them. Frankly does not verify them.
How we got these numbers
The homes we compared it with · Chamberí
Every figure in this section: what it measures, where it comes from, and what we did to it.
Each card: price, m², beds, baths
per card
Measures
What each agency advertises.
Source
Listings published by the agencies, which Frankly reads every day.
Period
Today. Updates daily.
Method
None.
Kind of figure
Listing data, not verified
€/m² badge
per card
Measures
Asking price divided by built area.
Source
The same listings.
Period
Today.
Method
Price ÷ m², rounded to €1.
Kind of figure
We calculated this
Chip (x% over or under)
per card
Measures
Each home’s €/m² against the middle of the 94 similar homes (€9,558). Green only when below the 25th percentile.
Source
The same listings.
Period
Today.
Method
€/m² ÷ the middle €/m² − 1; within ±1% reads “About typical”.
Kind of figure
We calculated this
Difference line
per card
Measures
How the home differs from this one, from structured fields only: lift, floor, terrace, parking, condition.
Source
Listings published by the agencies, which Frankly reads every day.
Period
Today.
Method
Never from the agency’s own description.
Kind of figure
Listing data, not verified
Homes shown
9
Measures
How many homes the carousel holds: this one and the closest in size.
Source
The same listings.
Period
Today.
Method
The closest in size to this home, up to eight.
Kind of figure
We counted this
Attribution
Listing prices belong to the agencies that publish them. Frankly does not verify them.
How we got these numbers
Room to negotiate · Chamberí
Every figure in this section: what it measures, where it comes from, and what we did to it.
Kept their first price
87%
Measures
The share of homes that left the market without their asking price ever changing.
Source
Frankly’s daily record of every home that stopped being advertised in Chamberí.
Period
Past 12 months. Updates daily.
Method
247 ÷ 283.
Kind of figure
We counted this
Typical cut, among those that cut
5.2% · about €65,000
Measures
How far the homes that did cut came down, from first asking price to last. Applied to this price for scale only: most homes don’t cut.
Source
The same record.
Period
Past 12 months.
Method
Median total cut of the 36 homes that cut; × €1,250,000, rounded to €1,000.
Kind of figure
We calculated this
This home
0 days · no cut
Measures
How long this home has been advertised, and whether its price has changed.
Source
Frankly’s daily record of this listing.
Period
Today.
Method
Days since we first saw it.
Kind of figure
We counted this
Homes left the market
283
Measures
Homes in Chamberí that stopped being advertised in the last 12 months. Disappearing usually means sold, but not always.
Source
Frankly’s daily record of listings.
Period
Past 12 months.
Method
Counted once each. Some agencies never take listings down, so their homes can’t be counted.
Kind of figure
We counted this
Cut the price first
13%
Measures
The share of those homes whose price was cut before they left.
Source
The same record.
Period
Past 12 months.
Method
36 ÷ 283.
Kind of figure
We counted this
Typical time advertised
38 days
Measures
The middle time from first advert to last: half left sooner, half later.
Source
The same record.
Period
Past 12 months.
Method
Median 38 days.
Kind of figure
We counted this
Attribution
Listing prices belong to the agencies that publish them. Frankly does not verify them.
How we got these numbers
Neighbourhood · Chamberí
Every figure on this card: what it measures, where it comes from, and what we did to it. Figures cover the official district, which includes Almagro.
Household income
€65,174
Measures
The average yearly net income per household living in Chamberí, against the same figure for Madrid city (€49,916).
Source
INE, Household Income Distribution Atlas (ADRH).
Period
2023. Yearly. Each edition covers the income year about two years earlier.
Method
None. Shown as published.
Kind of figure
Official record
Population
141,522 · down 1.6%
Measures
People registered as living in Chamberí, and the change on a year earlier.
Source
Ayuntamiento de Madrid, Padrón: population by district and barrio on 1 January.
Period
Jan 2026. Yearly, residents on 1 January; published mid-year.
Method
Sum of 6 barrios, padrón 1 January. The change is on the same date a year earlier.
Kind of figure
Official record
Average age
45.9
Measures
The average age of registered residents, against Madrid city (44.2, Sep 2026).
Source
Ayuntamiento de Madrid, Padrón: residents by census section, age and nationality (monthly).
Period
Sep 2026. Monthly snapshot of the register.
Method
Mean of single-year ages over 121 census sections, padrón 2026-09-01; 100 and over counted as 100.
Kind of figure
Official record
Aged 65 or over
24.7%
Measures
The share of registered residents aged 65 or over, against Madrid city (20.7%, Sep 2026).
Source
Ayuntamiento de Madrid, Padrón: residents by census section, age and nationality (monthly).
Period
Sep 2026. Monthly snapshot of the register.
Method
Residents aged 65 or over ÷ residents over 121 census sections, padrón 2026-09-01.
Kind of figure
Official record
Registered unemployment
4.0%
Measures
People registered as unemployed, as a share of the working-age population, against Madrid city (5.8%, Feb 2025). Not the survey (EPA) rate.
Source
Ayuntamiento de Madrid, District and barrio indicator panel.
Period
Feb 2025. Yearly panel; unemployment is the February count.
Method
February registered unemployed ÷ padrón residents aged 16–64.
Kind of figure
Official record
Years of income to buy
13.8 years
Measures
How many years of an average household’s income the typical home sold here costs.
Source
Ayuntamiento de Madrid × Colegio de Registradores, Registered home sales by district and barrio, 2007→ (city data bank); Comunidad de Madrid, Second-hand home price index (IPVCM), base 2022, by Madrid district; Ayuntamiento de Madrid, District and barrio indicator panel; INE, Household Income Distribution Atlas (ADRH).
Period
Sold price at Q2 2026 prices; size 2024; income 2023.
Method
Brought-forward sold price per m² (€9,108, every registered sale) × average size of homes sold (98.9 m², 2024) ÷ average net household income (€65,174, 2023) ≈ 13.8 years. Madrid, the same way: 9.8 years. It uses the price of every registered sale here, not only in the barrios of the homes we track: it is about the typical home sold, not our listings.
Kind of figure
We calculated this, from official records
Mortgage defaults and squatting
No grade
Measures
Why this page gives no grade for defaults or squatting (okupación).
Source
Only province-level data exists: Banco de España (delinquency), INE Ejecuciones hipotecarias (foreclosures), Ministerio del Interior (reported squatting).
Period
—
Method
A district grade would be invented precision, so we don’t make one.
Kind of figure
Nobody publishes this
Attribution
Elaboración propia con datos extraídos del sitio web del INE: www.ine.es, 2023. Licence CC BY 4.0.
Origen de los datos: Ayuntamiento de Madrid, 2024–2026. Licence CC BY 4.0.
Comunidad de Madrid, IPVCM, Q2 2026. Licence CC BY 4.0.
Source: Colegio de Registradores, via Ayuntamiento de Madrid statistics.
How we got these numbers
Sale · Chamberí
Every figure on this card: what it measures, where it comes from, and what we did to it.
Asking price per m²
€10,215
Measures
The middle asking price per m² of the 423 homes for sale in Chamberí today. Half ask less, half ask more.
Source
Listings published by 32 agencies, which Frankly reads every day.
Period
Today. Updates daily.
Method
Asking price divided by built area for each home, then the middle value.
Kind of figure
Listing data, not verified
Madrid, homes we track
€11,013
Measures
The same middle asking price per m², across the 5,365 homes we track in Madrid.
Source
The same agency listings.
Period
Today. Updates daily.
Method
As above, over all Madrid districts we cover.
Kind of figure
Listing data, not verified
Price trend
up 10.6% · up 3.9%
Measures
How the prices of all second-hand homes sold in Chamberí changed: over a year, and over the last quarter.
Source
Comunidad de Madrid, Second-hand home price index (IPVCM), base 2022, by Madrid district.
Period
Q2 2026. Quarterly, about two months after the quarter ends.
Method
The yearly change is as published. The quarterly change is not published for this district, so we calculate it from the index itself (this quarter ÷ last quarter − 1).
Kind of figure
Official record (the quarterly change is calculated by us)
Homes here sold for about
€8,850/m²
Measures
What second-hand homes sold for per m² in registered sales, in the same barrios as the homes we track, brought up to the latest quarter. Each barrio counts as much as it has homes we track.
Source
Ayuntamiento de Madrid × Colegio de Registradores, Registered home sales by district and barrio, 2007→ (city data bank). Barrio table, second-hand homes. Brought forward with Comunidad de Madrid, Second-hand home price index (IPVCM), base 2022, by Madrid district.
Period
2025 average, brought up to Q2 2026. Yearly, covering the previous year's registered sales.
Method
Each barrio's registered 2025 price, weighted by how many of the homes we track sit there: Trafalgar 41% × €8,595 + Ríos Rosas 22% × €7,928 + Arapiles 16% × €7,595 + Gaztambide 11% × €7,412 + Vallehermoso 10% × €6,789 + Almagro 0% × €10,762 ≈ €7,986. Brought forward with the same IPVCM factor as the district figure: × 1.107 ≈ €8,839, shown as €8,850. 290 of 423 homes (69%) could be placed in a barrio; the other 133 are left out of the weights. We bring it forward because a 2025 price read today would look cheap.
Kind of figure
Official record, brought forward by us
Asking vs sold
+15%
Measures
How the asking prices of the homes we track compare with what homes sold for in the same barrios. A description of our listings, not a verdict.
Source
The asking price and the sold price above.
Period
Today’s asking prices against Q2 2026 sold prices.
Method
€10,215 ÷ €8,850 − 1 = 15.4%, shown as about 15%. The sold price is weighted to the barrios the homes we track are in, so the difference in location is taken out. What is left is the gap between asking and selling, plus any difference in the homes themselves within a barrio.
Kind of figure
We calculated this
Priced below our fair value
33%
Measures
The share of homes for sale that ask less per m² than three in four similar homes nearby.
Source
Frankly’s fair-value comparison, over the listings above.
Period
Today. Updates daily.
Method
Each home is compared with similar homes in the district by size, bedrooms and condition. 124 of the 374 homes we can compare fall in the cheapest quarter.
Kind of figure
We calculated this
Typical time advertised
137 days
Measures
The middle number of days the homes for sale have been advertised.
Source
Frankly’s daily record of each listing.
Period
Today. Updates daily.
Method
Days since we first saw each listing, then the middle value. A home that is taken down and listed again starts from zero.
Kind of figure
We counted this
Have cut their price
18%
Measures
The share of homes for sale whose asking price has dropped at least once.
Source
Frankly’s price history for each listing.
Period
Today. Updates daily.
Method
75 of the 423 homes have at least one recorded drop.
Kind of figure
We counted this
Attribution
Comunidad de Madrid, IPVCM, Q2 2026. Licence CC BY 4.0.
Source: Colegio de Registradores, via Ayuntamiento de Madrid statistics.
Listing prices belong to the agencies that publish them. Frankly does not verify them.
How we got these numbers
Rent · Chamberí
Every figure on this card: what it measures, where it comes from, and what we did to it.
Asking rent per m²
€33.3
Measures
The middle monthly asking rent per m² of the 125 homes to rent in Chamberí today.
Source
Listings published by 40 agencies, which Frankly reads every day.
Period
Today. Updates daily.
Method
Monthly rent divided by built area for each home, then the middle value.
Kind of figure
Listing data, not verified
Madrid, homes we track
€29.7
Measures
The same middle asking rent per m², across the 1,343 homes to rent we track in Madrid.
Source
The same agency listings.
Period
Today. Updates daily.
Method
As above, over all Madrid districts we cover.
Kind of figure
Listing data, not verified
What tenants declared, per m² a month
€18.6 per m²
Measures
What tenants actually pay, from the rents landlords declare in their income-tax returns: flats let as a main residence, lets to relatives excluded. It arrives about two years late. Flats in buildings only; houses are a separate series. MIVAU withholds any census section with fewer than 10 lets. Not comparable with the asking rents above: two years apart, and the whole rental market rather than the homes we track.
Source
MIVAU, State rent reference index (SERPAVI): rents declared in tax returns, by municipality, district and census section.
Period
2024. Yearly. Each edition covers the tax year about two years earlier (the 2026 edition has 2024).
Method
None. We show the median MIVAU publishes.
Kind of figure
Official record
Declared-rent index
up 4.1% that year
Measures
How rents declared for tax changed in Chamberí over 2024: INE’s rental price index, built from the same tax returns. A separate series from the € figure, so the two can differ.
Source
INE, Rental price index (IPVA), base 2015, by municipality and district.
Period
2024. Yearly, in spring, covering the tax year about 17 months earlier (May 2026 published 2024).
Method
None. We show the yearly change INE publishes.
Kind of figure
Official record
To rent now
125
Measures
Homes advertised to rent in Chamberí today.
Source
Listings published by 40 agencies, which Frankly reads every day.
Period
Today. Updates daily.
Method
Counted once each, across agencies.
Kind of figure
We counted this
Typical rent
€2,995 a month
Measures
The middle monthly asking rent. Half ask less, half ask more.
Source
The same agency listings.
Period
Today. Updates daily.
Method
The middle value of the monthly asking rents.
Kind of figure
Listing data, not verified
Typical time listed
112 days
Measures
The middle number of days the homes to rent have been advertised.
Source
Frankly’s daily record of each listing.
Period
Today. Updates daily.
Method
Days since we first saw each listing, then the middle value. A home that is taken down and listed again starts from zero.
Kind of figure
We counted this
Attribution
Elaboración propia con datos extraídos del sitio web del INE: www.ine.es, 2024. Licence CC BY 4.0.
Source: Ministerio de Vivienda y Agenda Urbana, SERPAVI, 2011–2024 database (file last updated 9 July 2026); figures for 2024. Reused under the ministry’s terms, which require this citation.
Listing prices belong to the agencies that publish them. Frankly does not verify them.
How we got these numbers
The building itself
Every figure in this section: what it measures, where it comes from, and what we did to it.
Year built, floor, lift
1963
Measures
What the listing says.
Source
Listings published by the agencies, which Frankly reads every day.
Period
Today.
Method
None.
Kind of figure
Listing data, not verified
Attribution
Listing prices belong to the agencies that publish them. Frankly does not verify them.
How we got these numbers
Things that would change the deal
Every figure in this section: what it measures, where it comes from, and what we did to it.
Tourist lets in this district
Restricted here
Measures
Whether new tourist flats are allowed here.
Source
Ayuntamiento de Madrid, Plan Especial de Hospedaje, as summarised in Frankly’s district notes.
Period
Plan in force, 2026.
Method
None.
Kind of figure
Official record
The five situations
Ask the agency
Measures
We don’t yet read listings for these, so each one says “Ask the agency”.
Source
—
Period
—
Method
—
Kind of figure
Nobody publishes this
Whether a big repair bill is coming
—
Measures
A derrama is a one-off charge on all owners for major building work. Ask for the last three years of owners’ meeting minutes.